GeoToolkit energy visualization libraries
Empowering high-performance data visualization applications
Overview
Easy application development through efficient, domain-specific libraries.
GeoToolkit energy visualization libraries are a powerful suite of high-performance components, designed for developers seeking to rapidly build or extend advanced geoscience visualization software. Your developers can use the libraries to create stunning seismic displays, well logs, schematics, contour maps, charts, and more with ease.
Deploy faster
GeoToolkit's libraries are designed for speed and flexibility. Whether you need a quick plug-and-play solution or want to build a custom application from the ground up, they help you get your custom apps to market faster.
Build it your way
Develop your industrial applications using a wide range of programming languages, including JavaScript, Python, TypeScript, .NET, Java, and C++.

Applications
GeoToolkit libraries at a glance
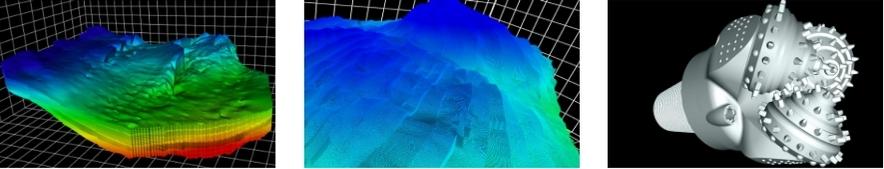
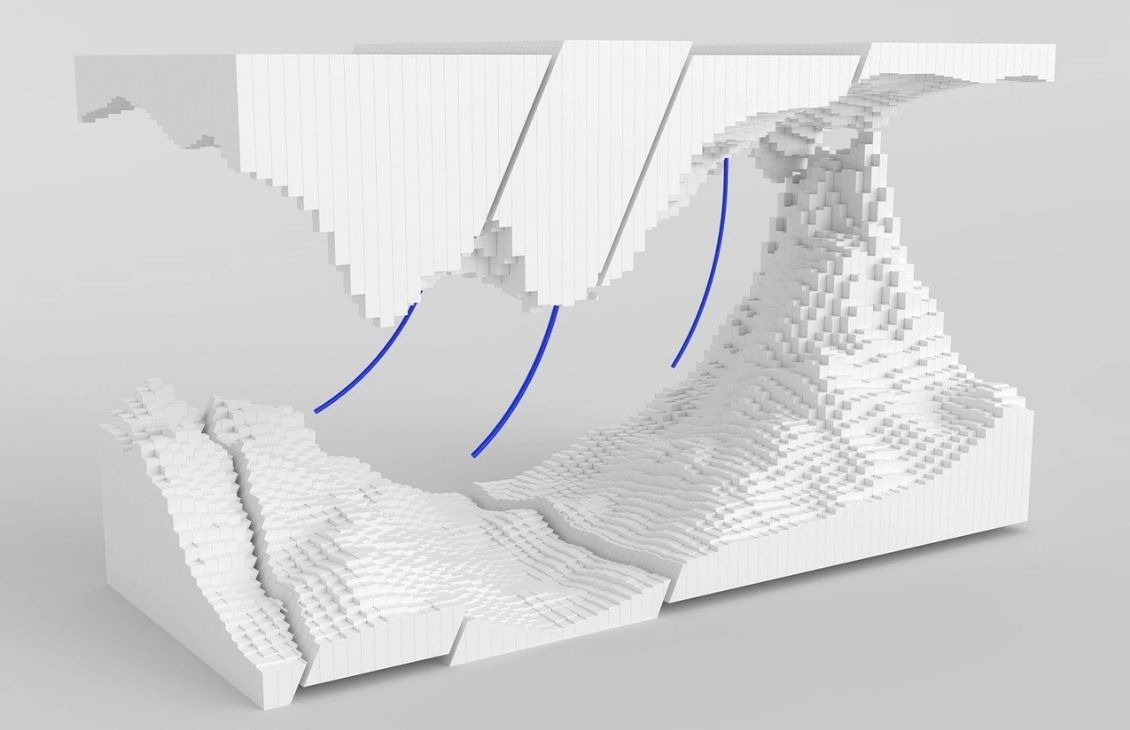
3D rendering
A feature-rich 3D library for developing professional applications in oil & gas, CAD, engineering, and mining. Display your seismic and reservoir data in 3D. The 3D module is available in Java and JavaScript/TypeScript. The 3D plot uses WebGL technology to achieve GPU rendering in the browser and OpenGL to render graphics in Java.
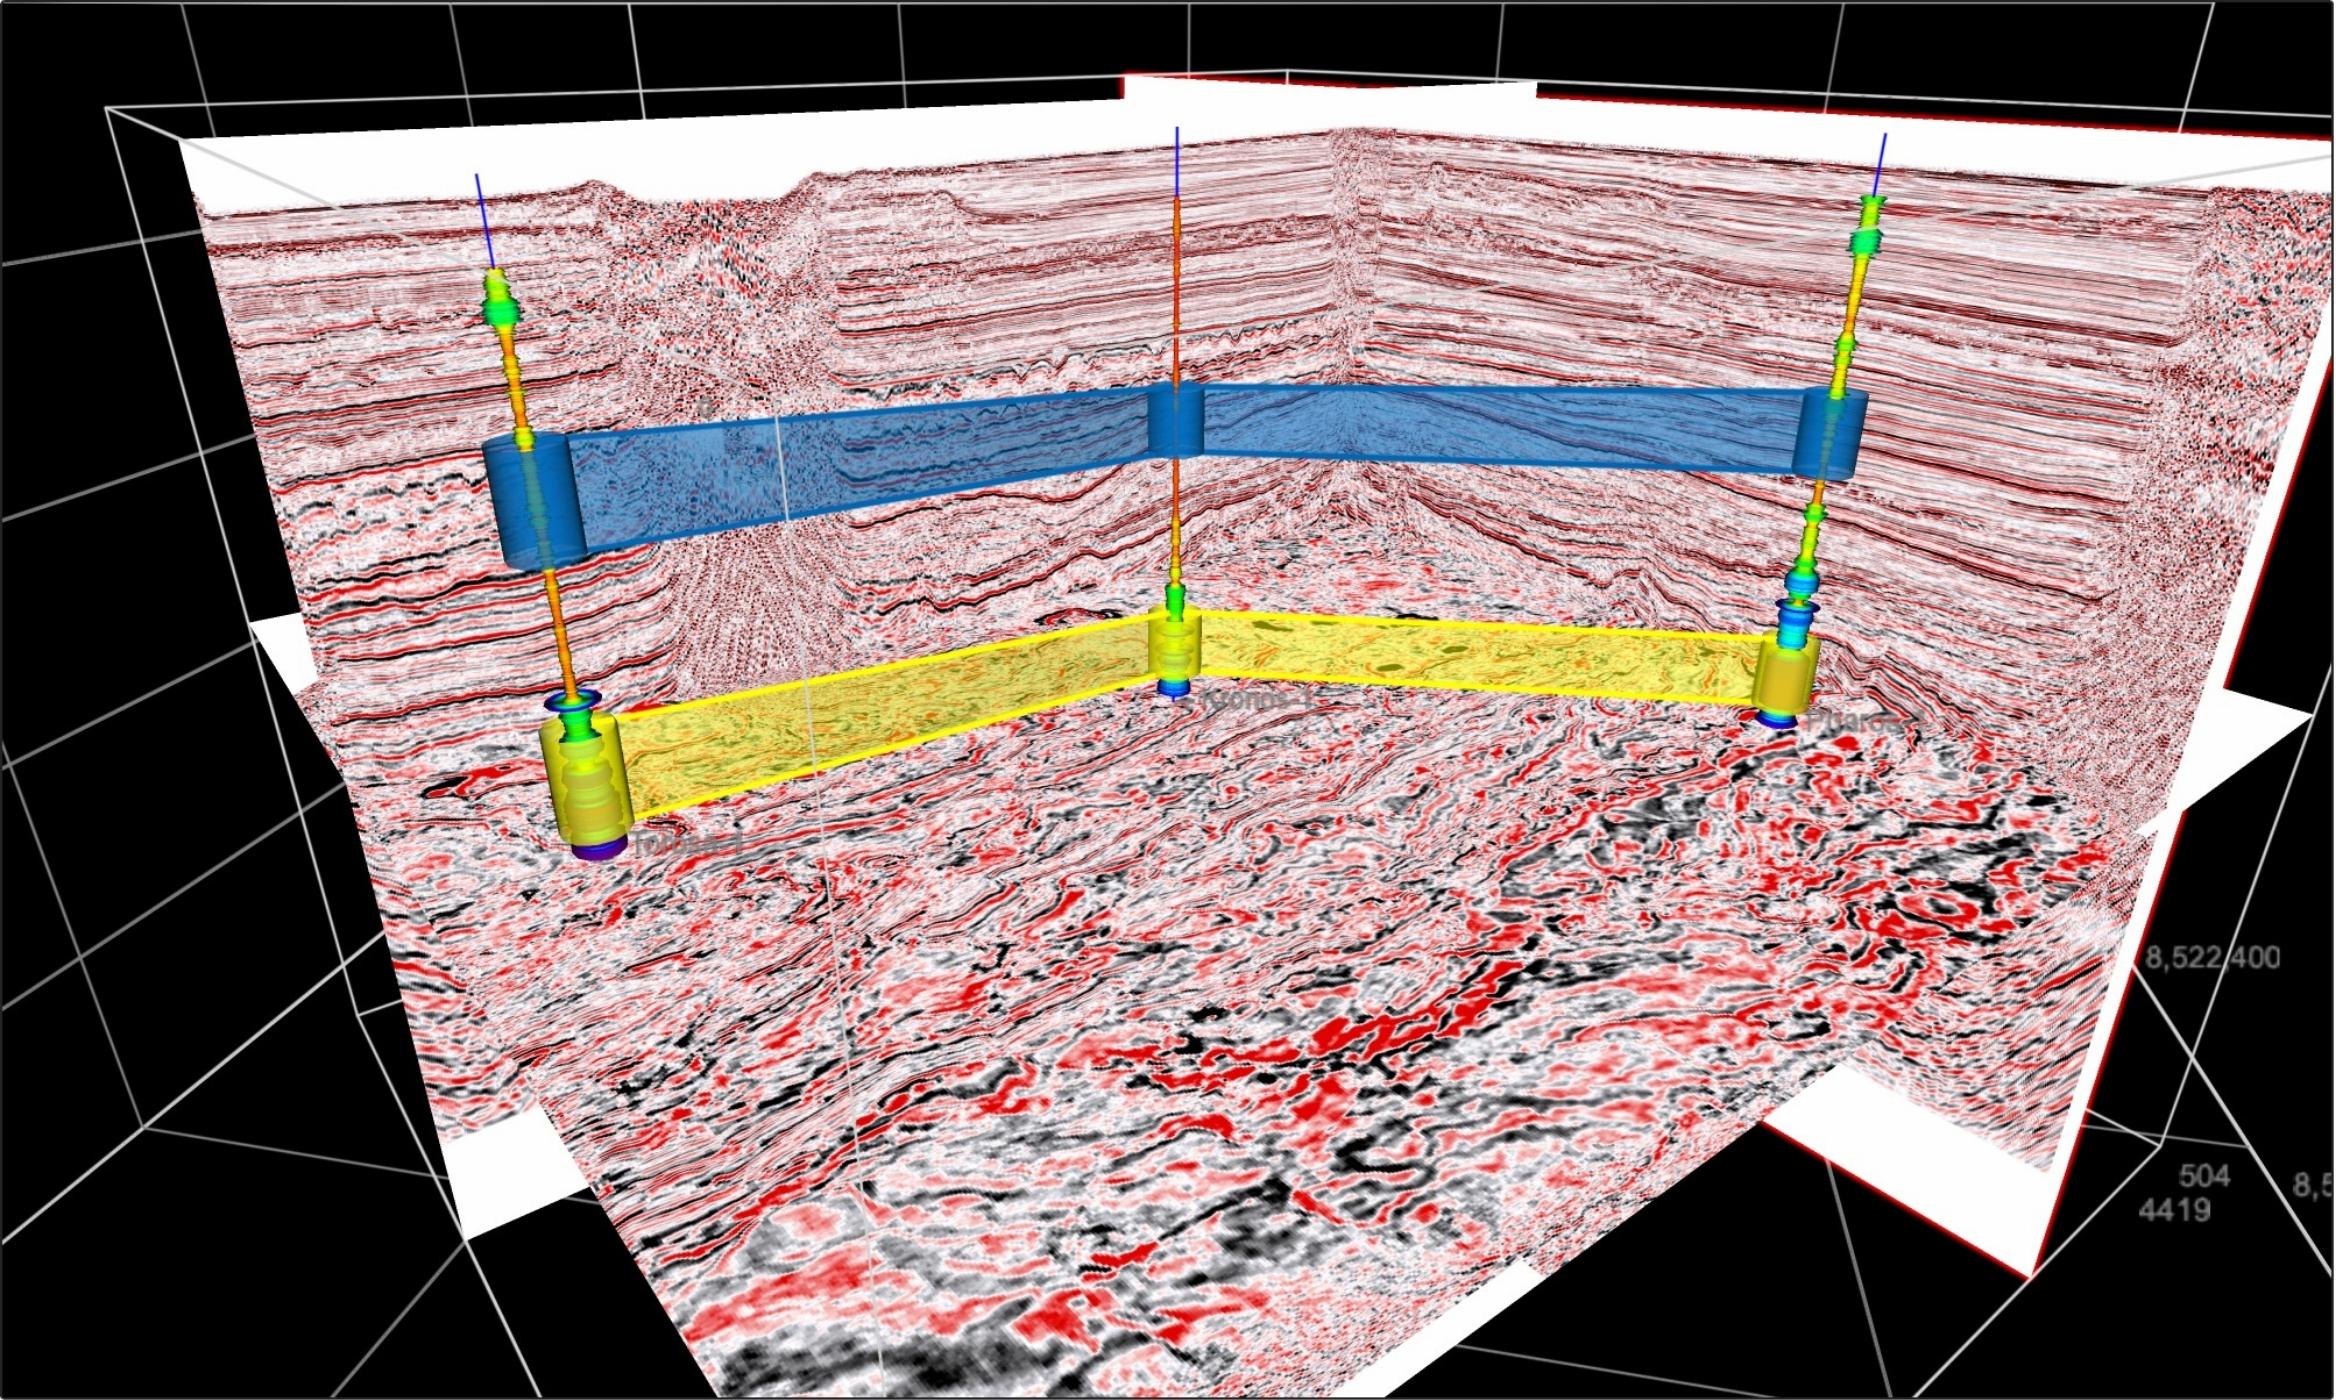
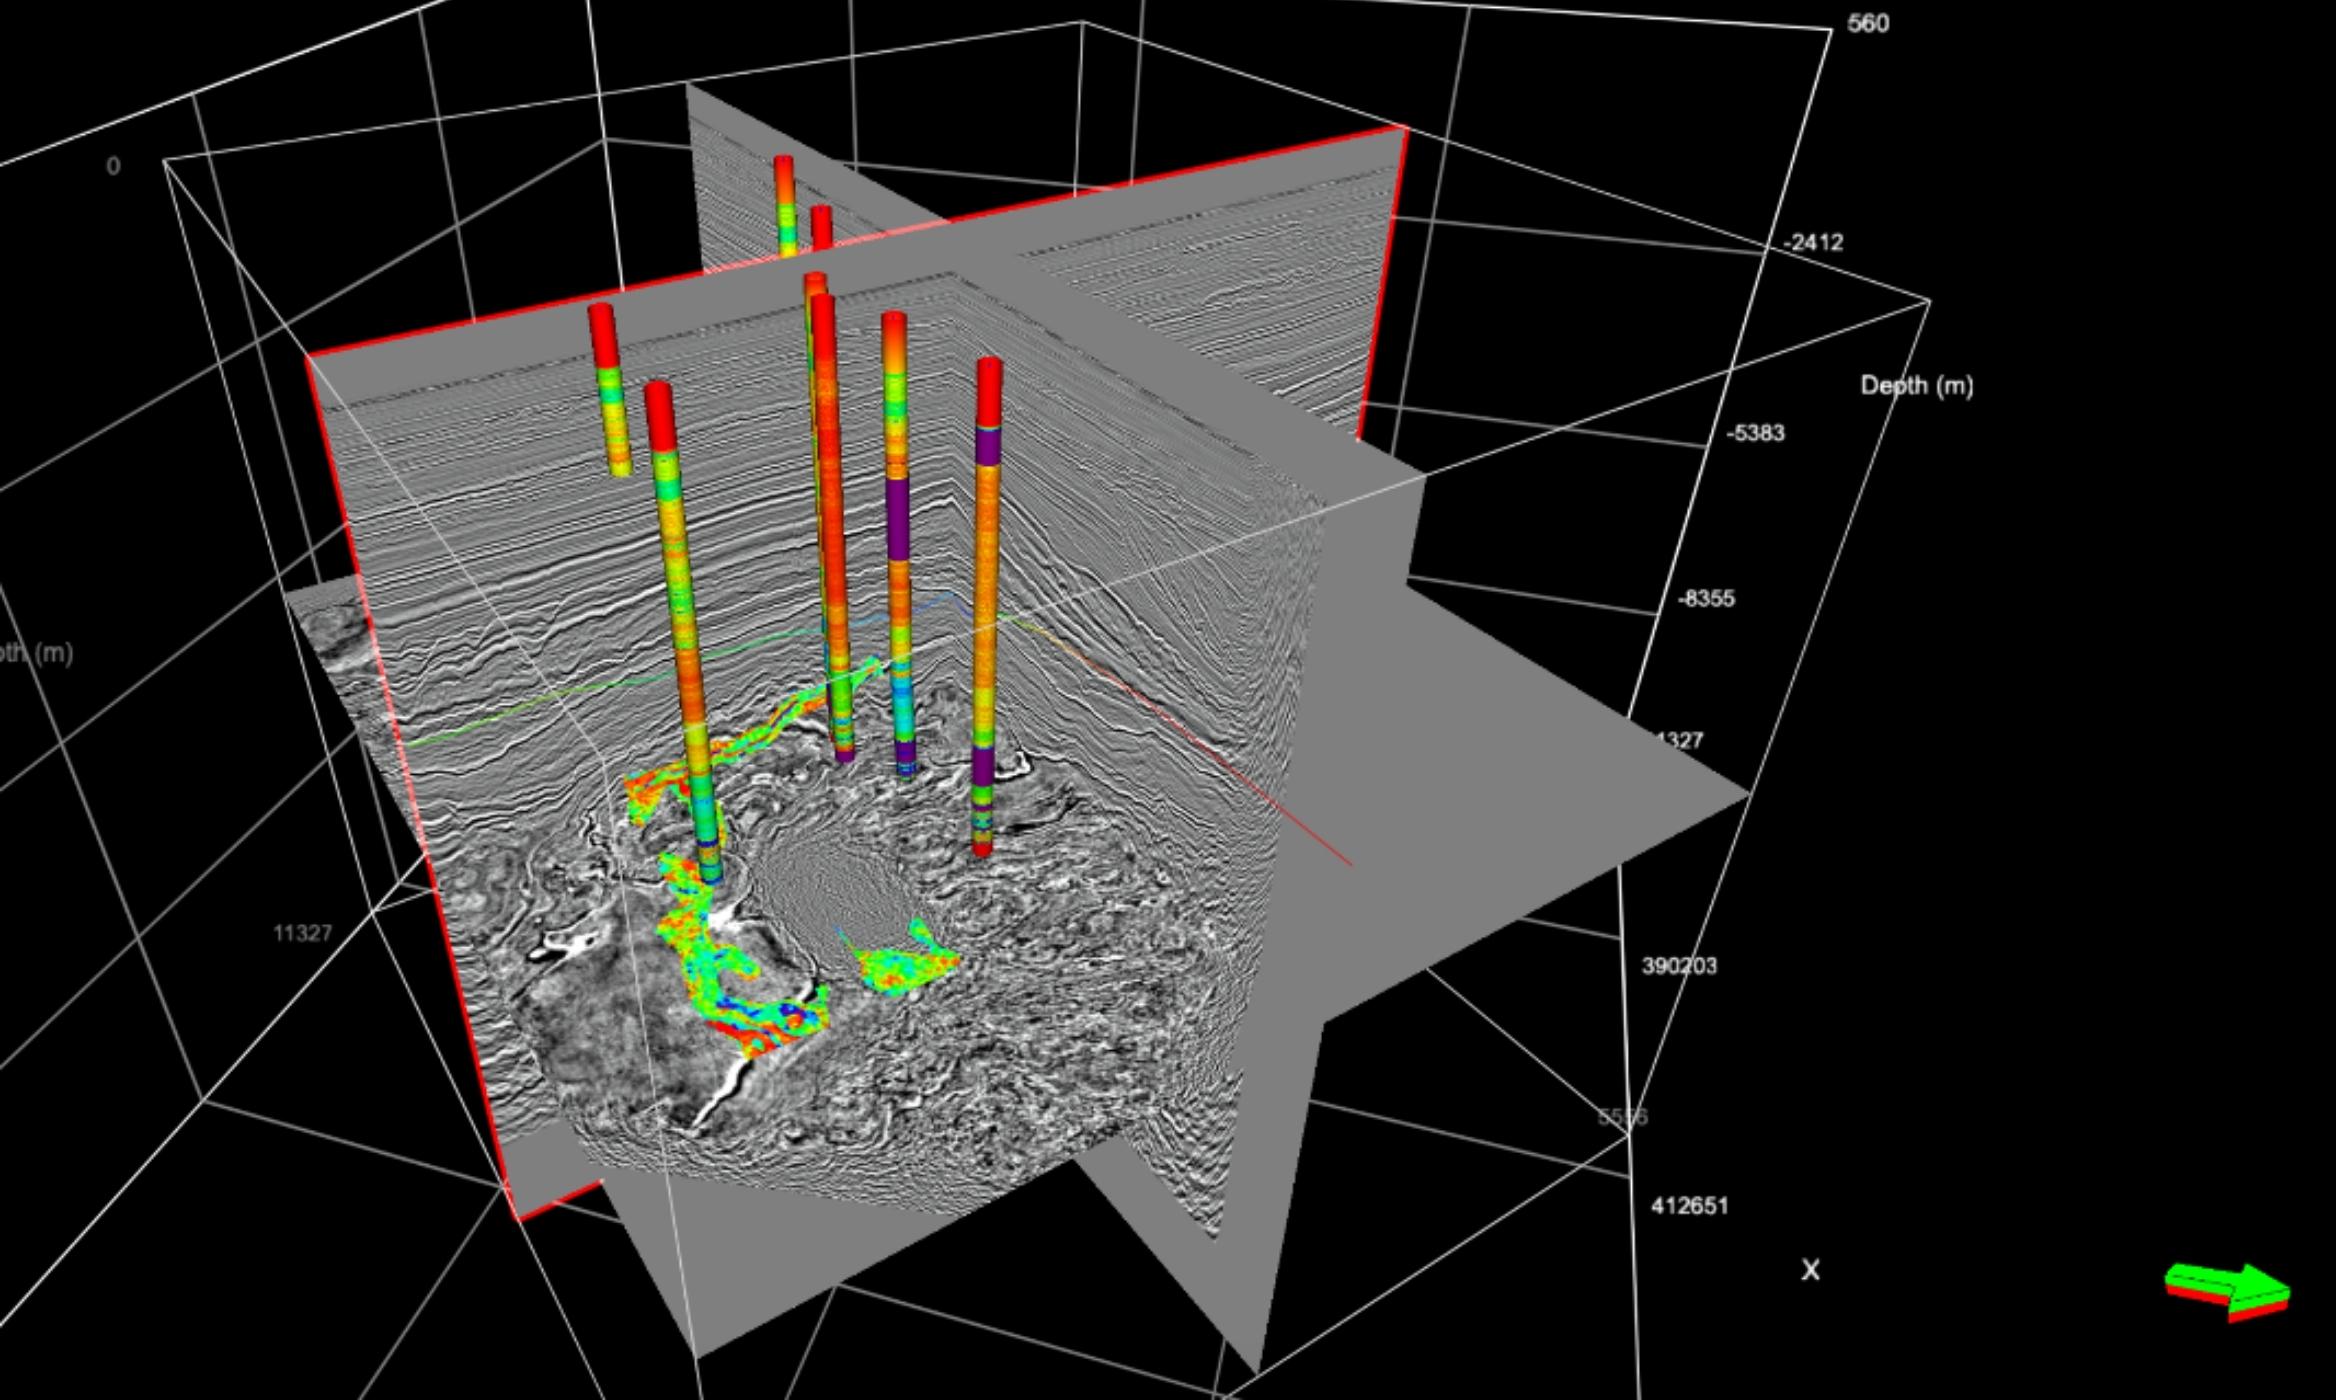
Seismic in 2D, 3D and 4D
View, interpret, edit, and process 2D,3D and 4D seismic data with integrated components to overlay annotation, picks, logs, or contours. View broadband seismic, 3D and 4D seismic, or view seismic data in real time. 2D supports server-side and client-side rendering.
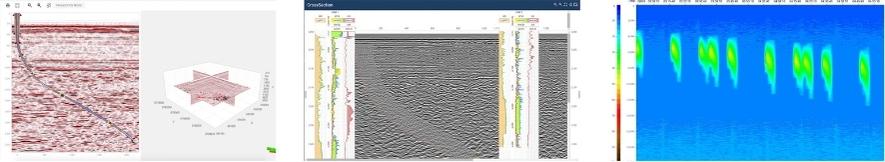
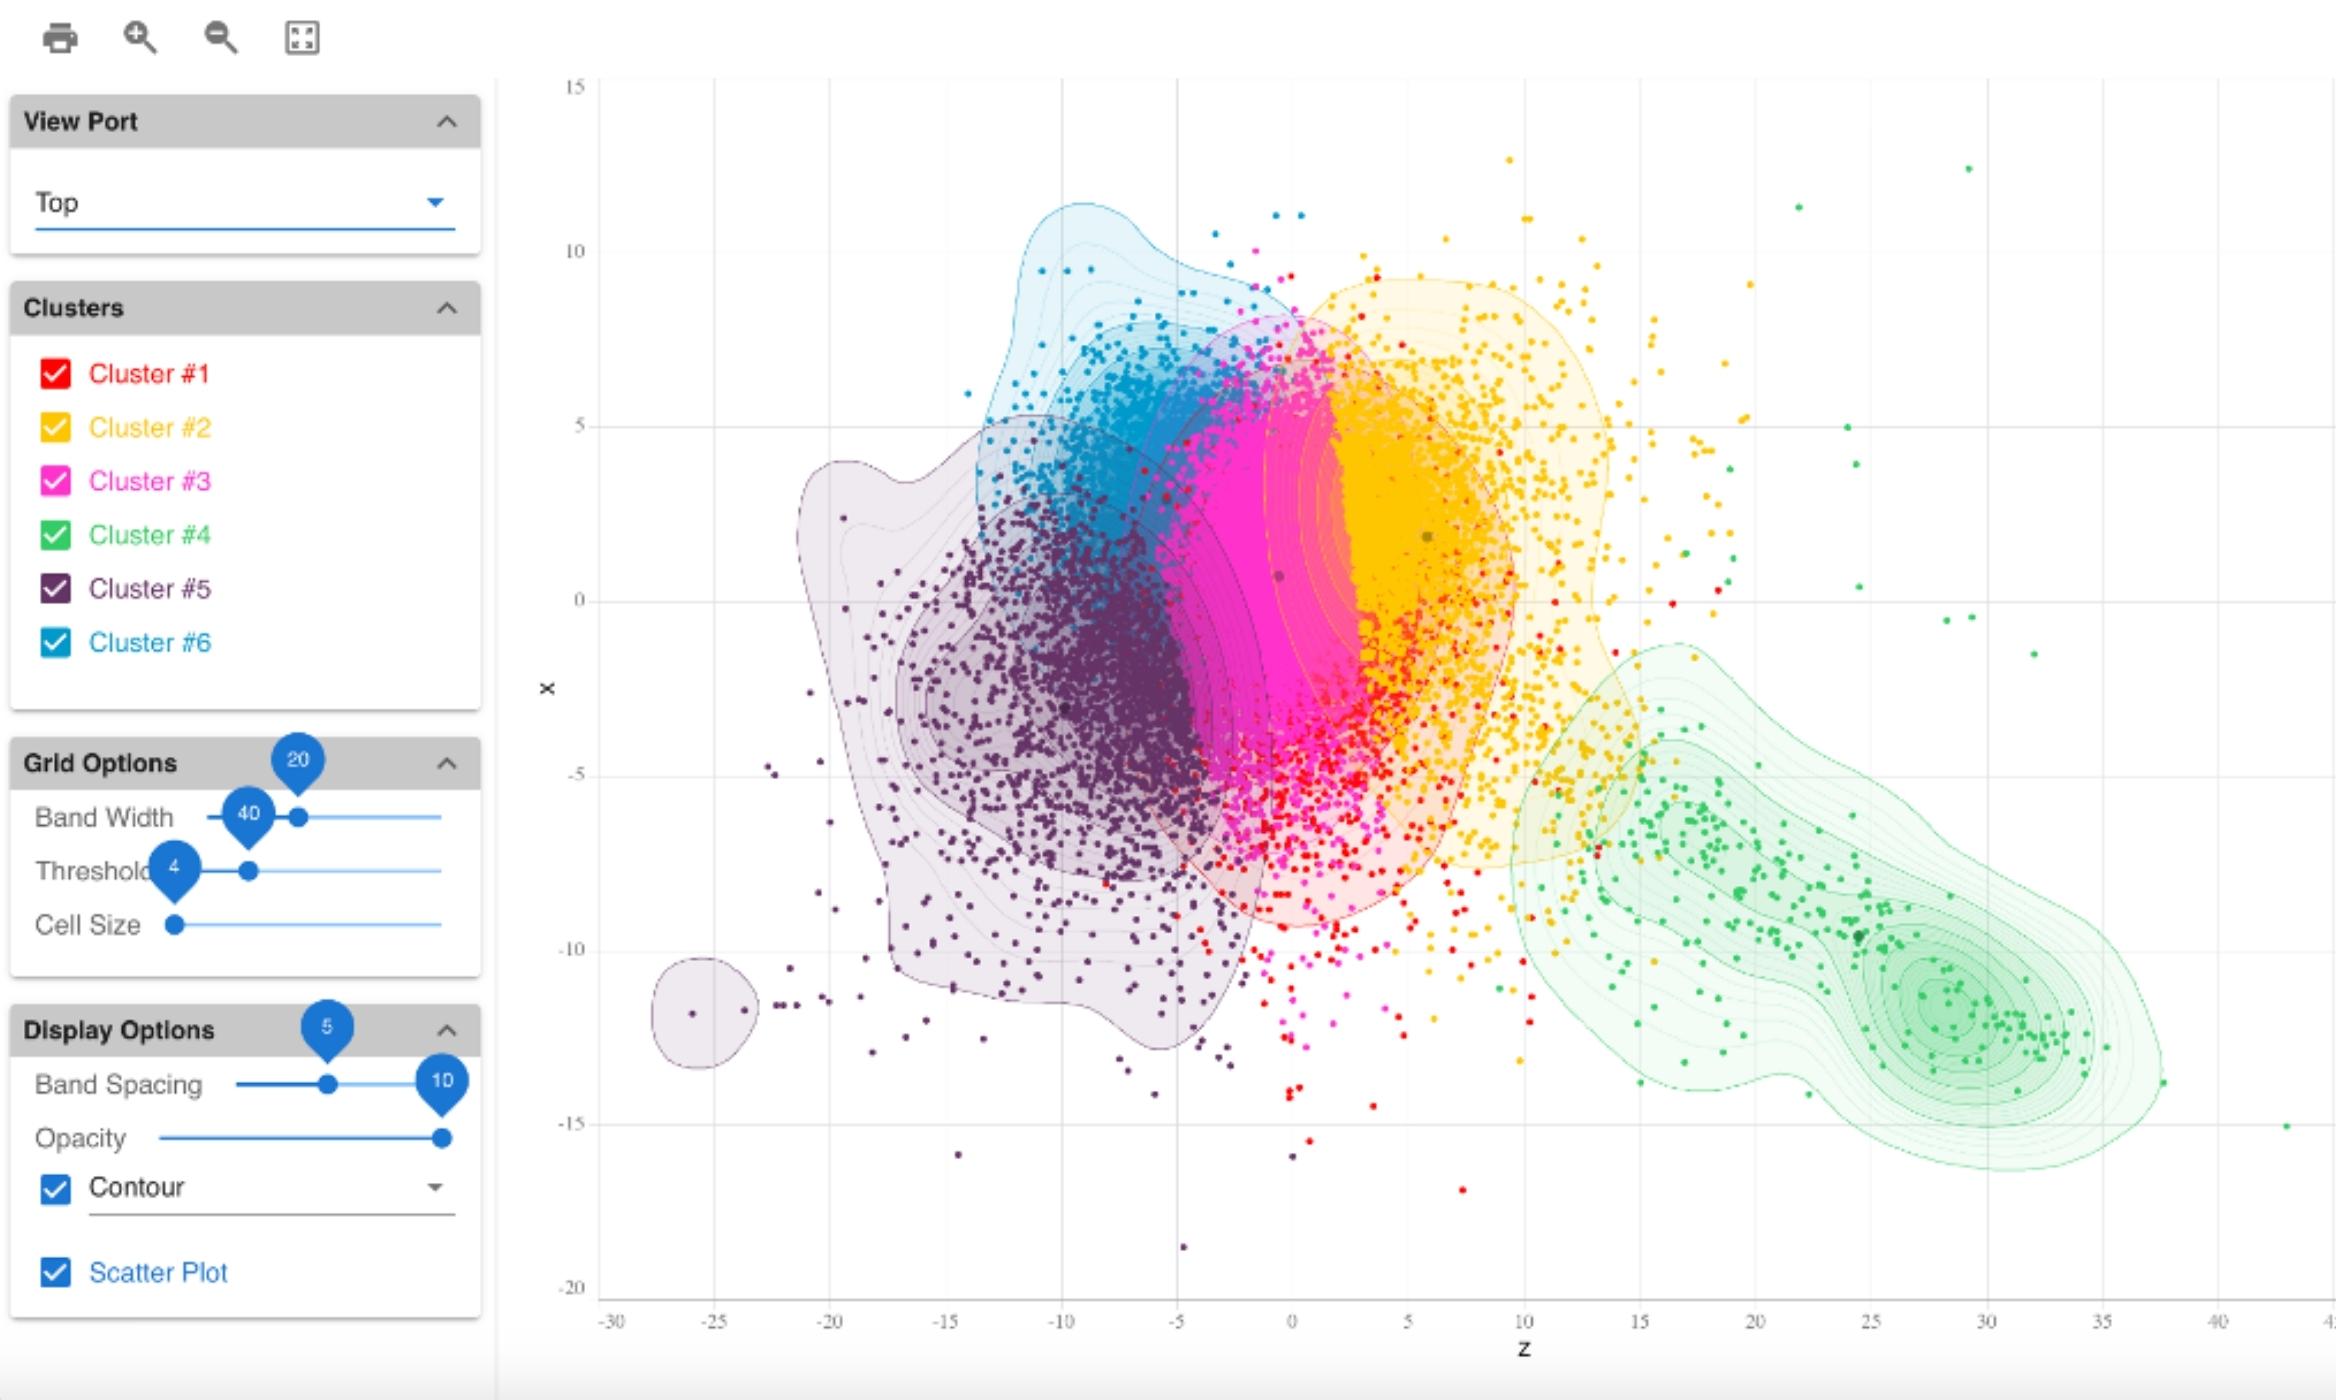
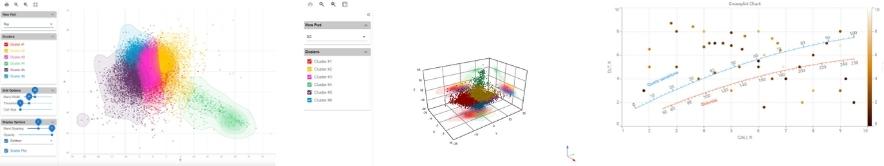
Crossplot
Compare measurements along two or more axes with this 2D scatter plot visualization. Customize your graph to display reservoir characterization, seismic, or to interpret geophysical, geochemical, and hydrologic data. GeoToolkit libraries offers both linear and logarithmic crossplots.
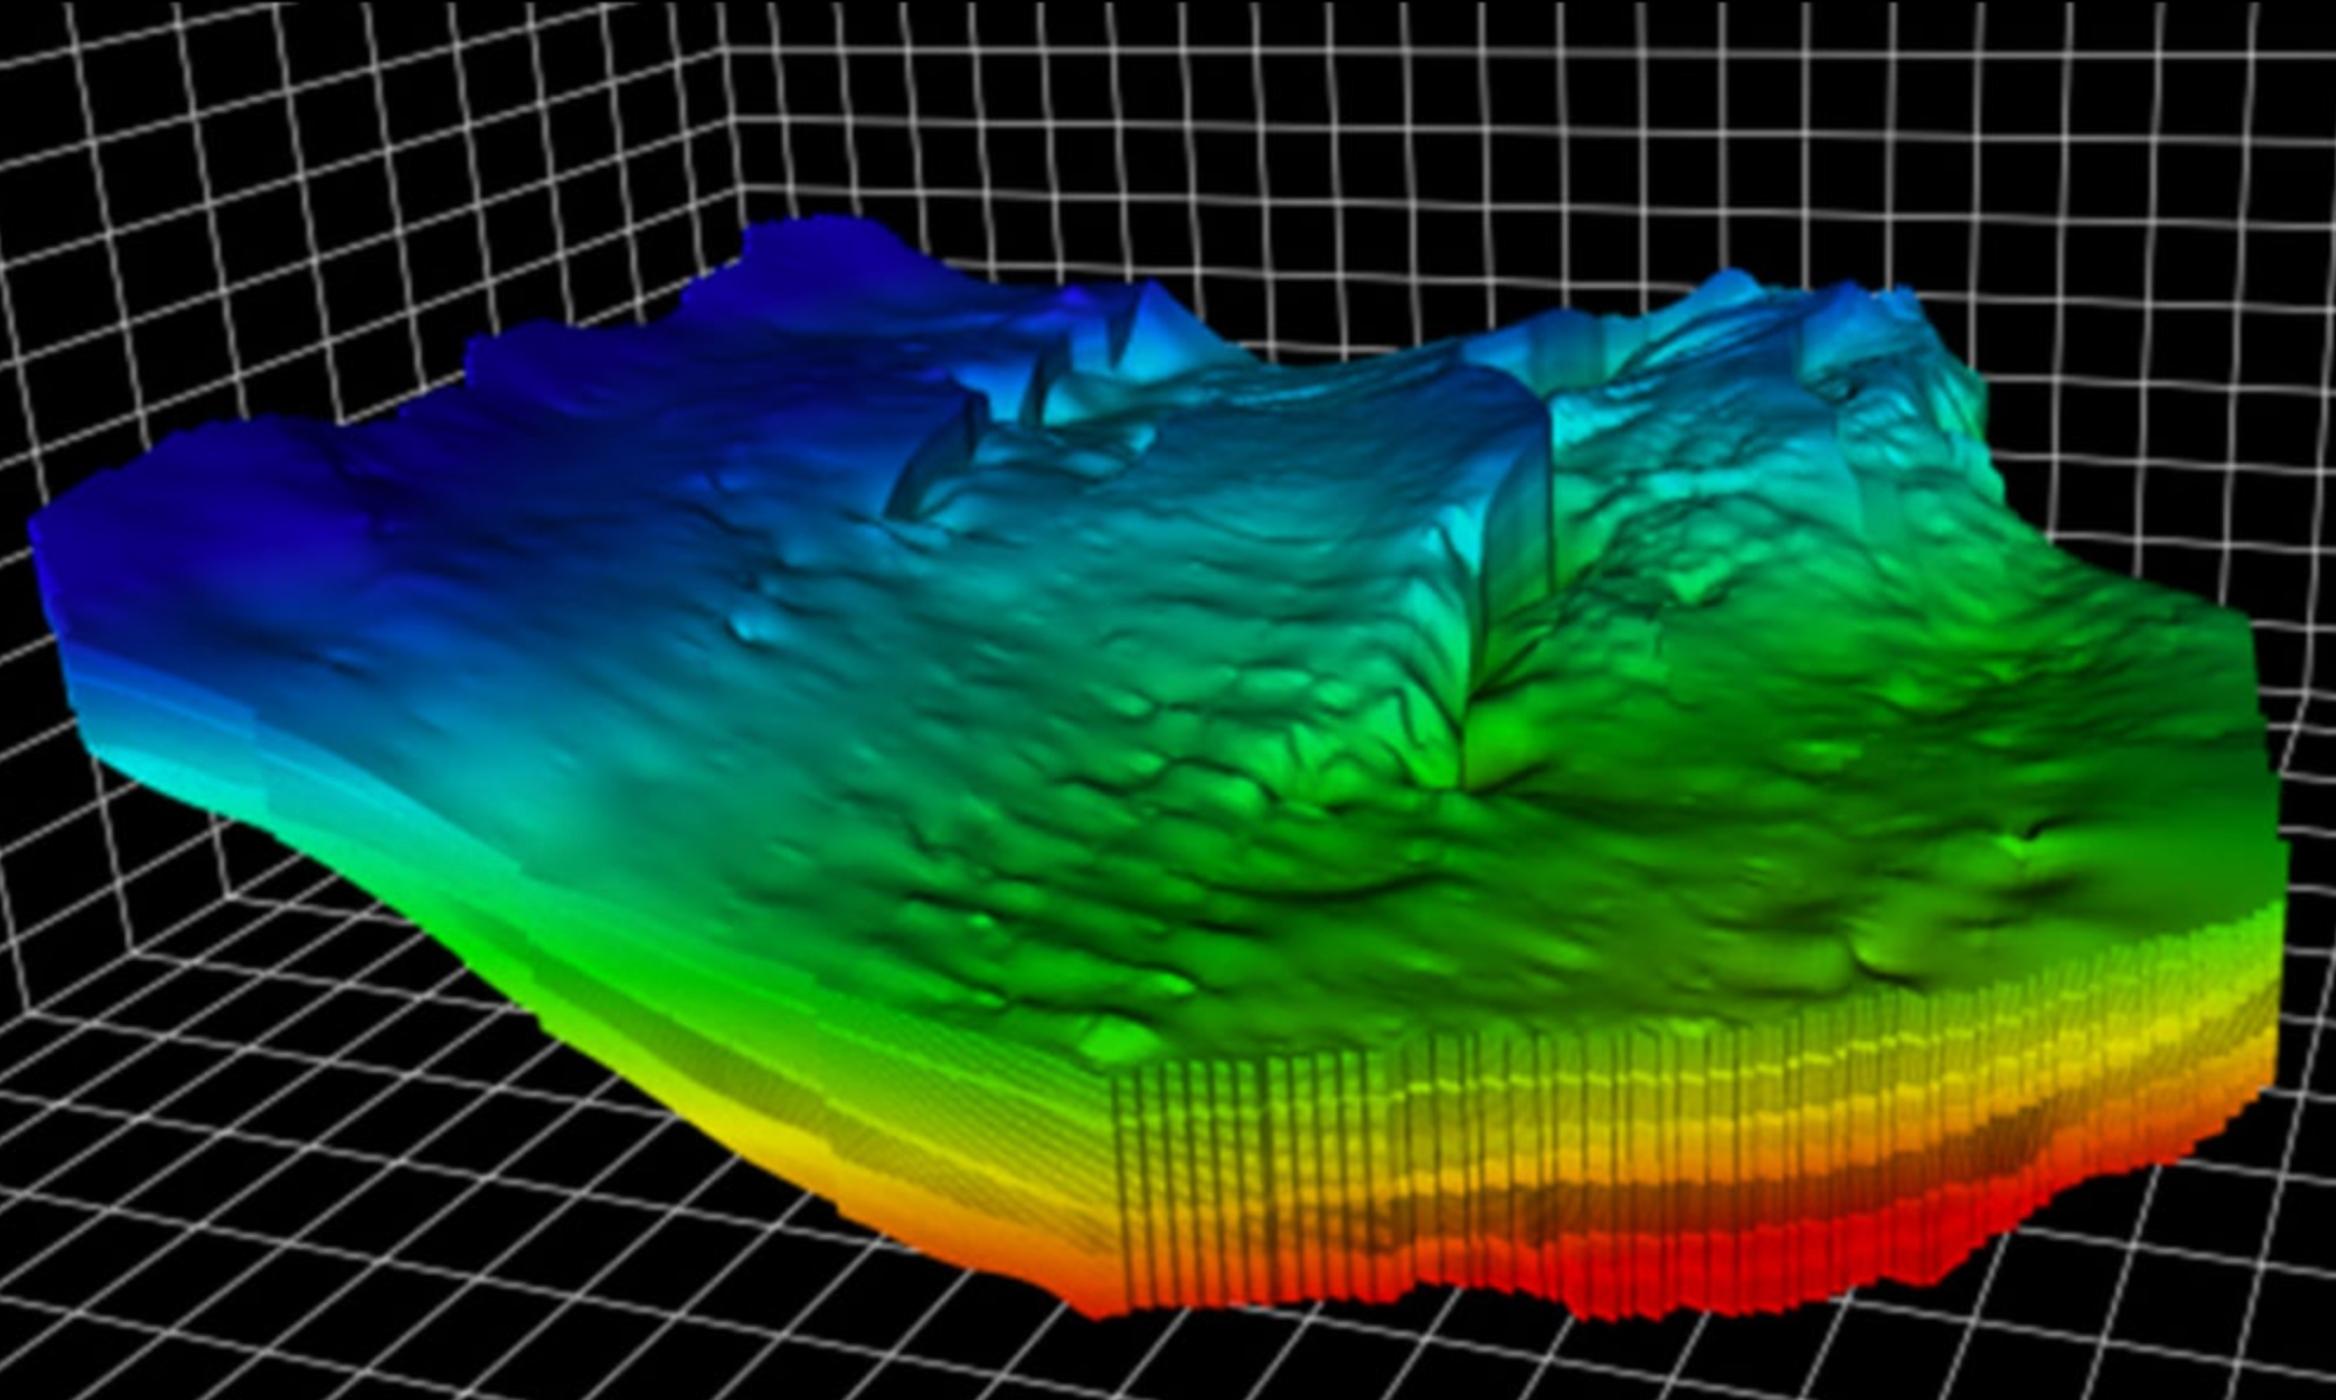
Large volume rendering
Create high-quality, high-performance visualizations of very large datasets, including billions of cells (gigagrid), using our library of 3D components. These are designed for interpretation, 3D tool design validation, reservoir rendering, analysis, and QC. They provide volumetric rendering capabilities (including external renderers like Intel OSPRay, NVIDIA IndeX).
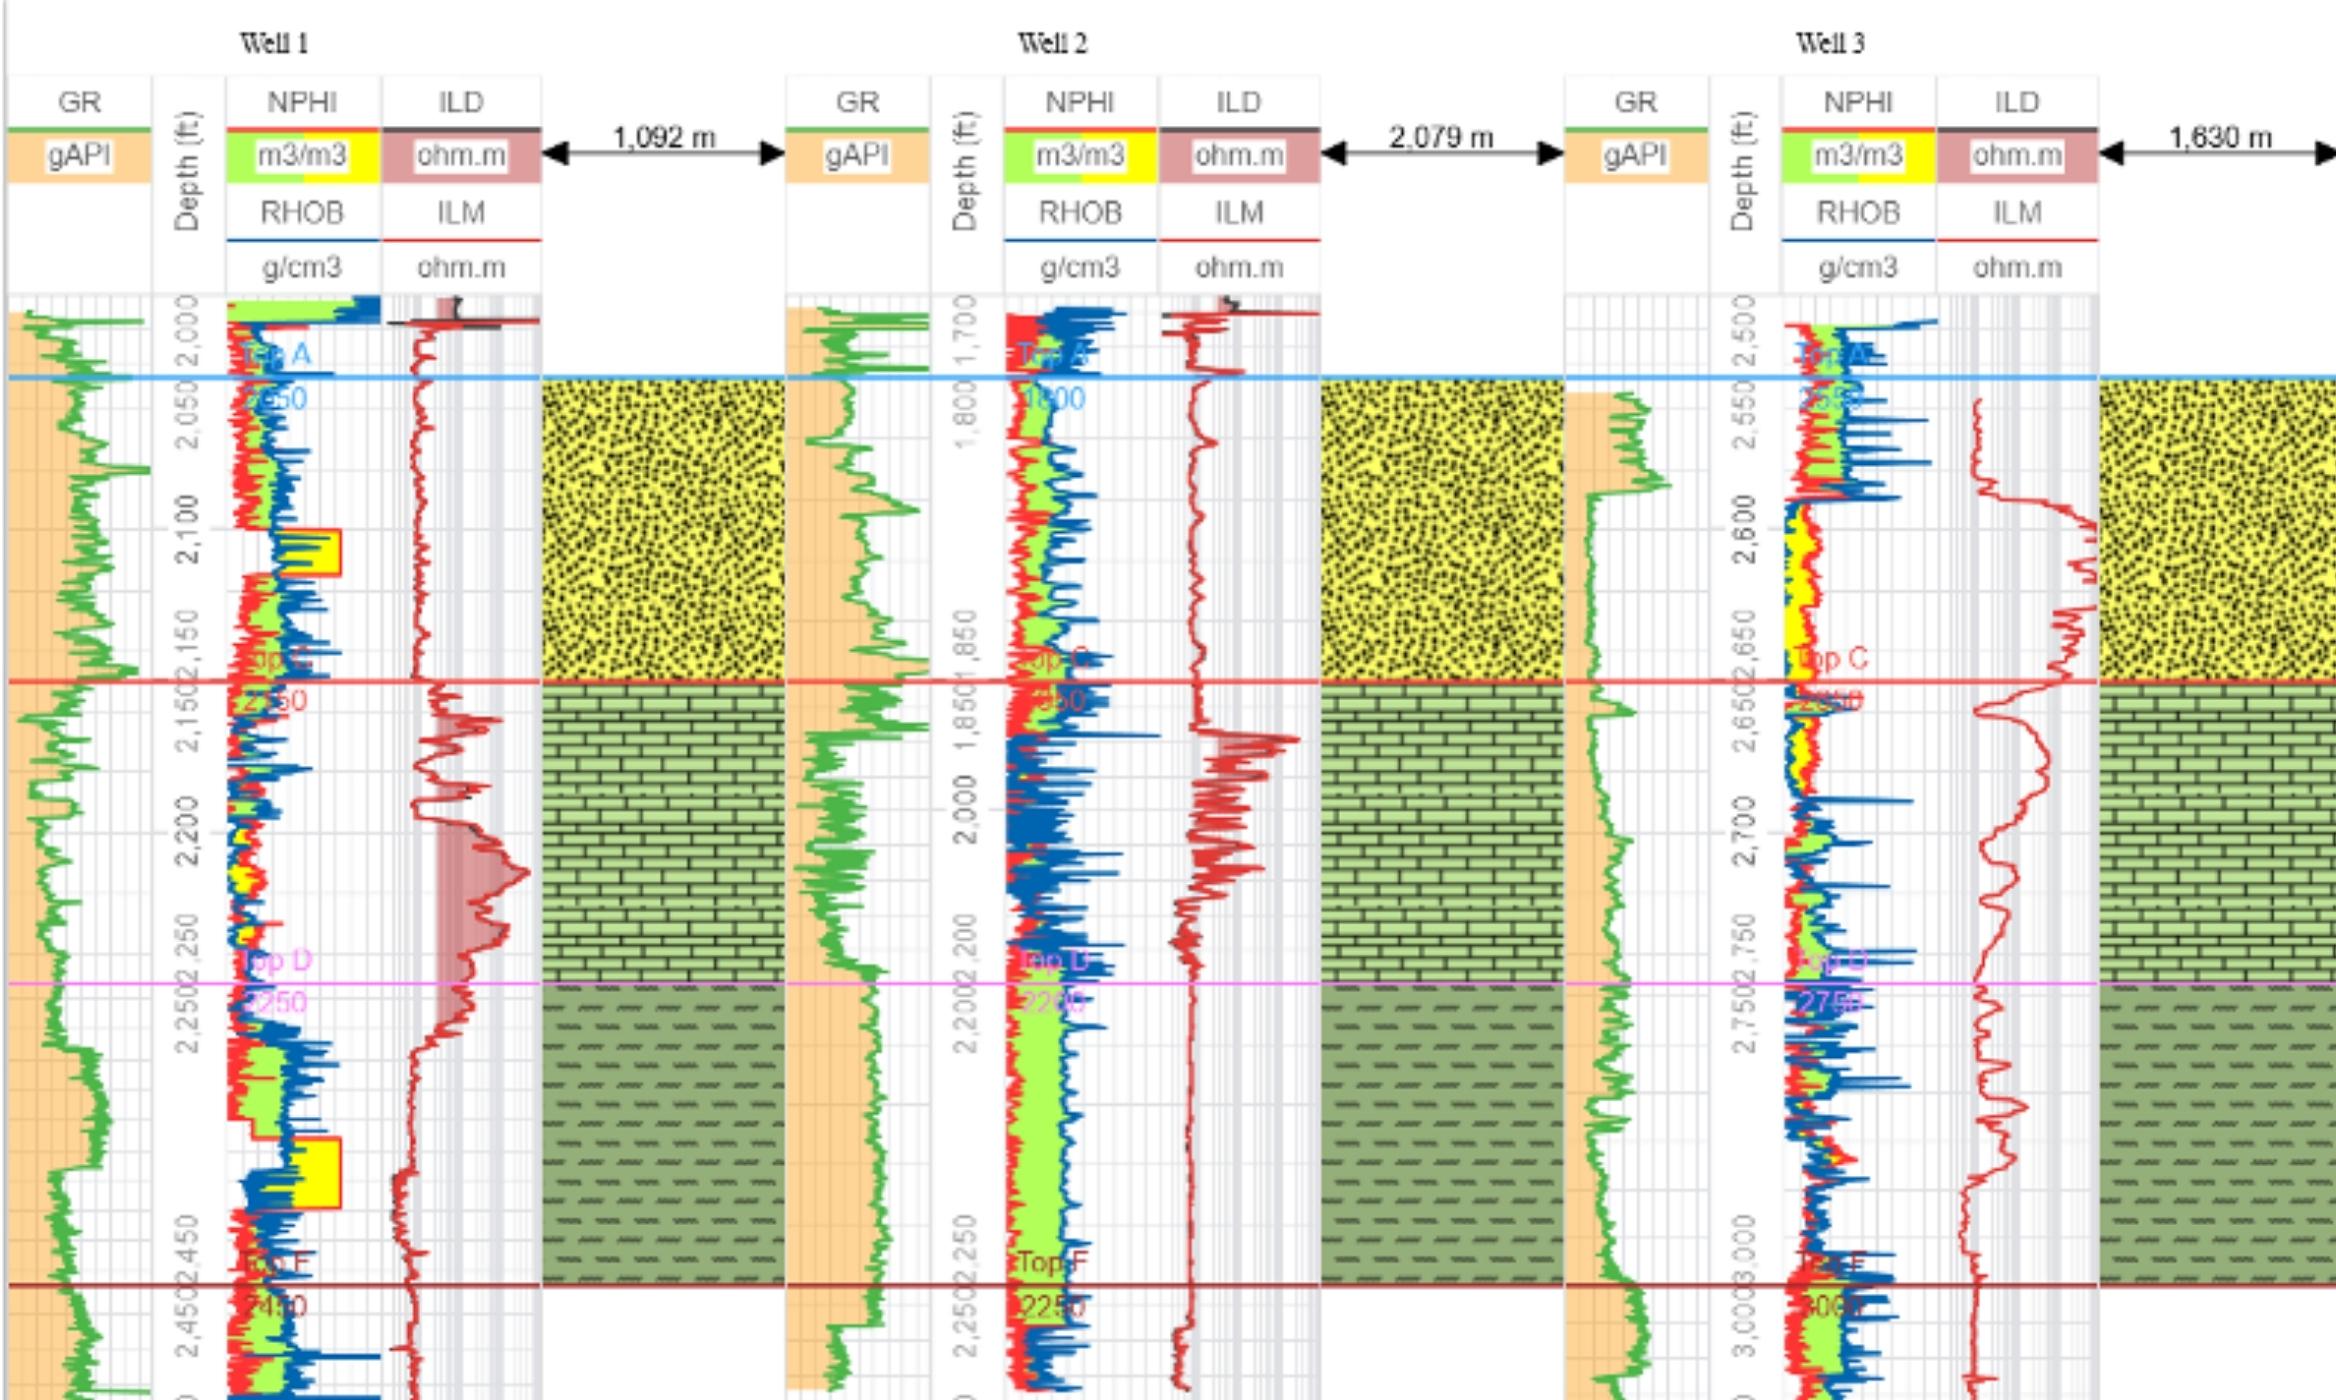
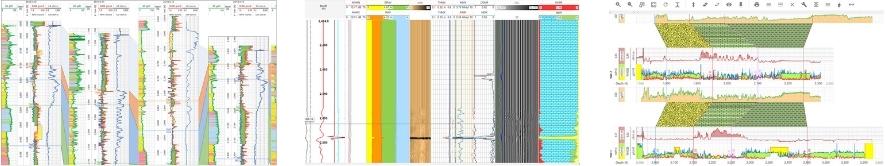
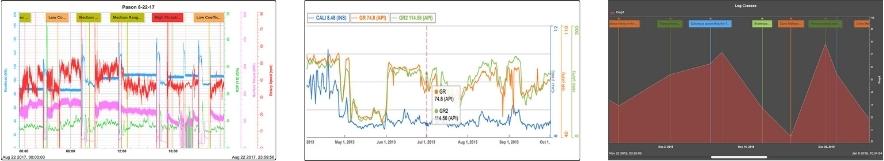
Well logs
Build subsurface drilling, petrophysical analysis, or data management applications with single or multi-well displays that can correlate more than 1,000 wells in seconds. Connect to real-time data such as WITSML and display horizontal, deviated, map, and 3D well logs.
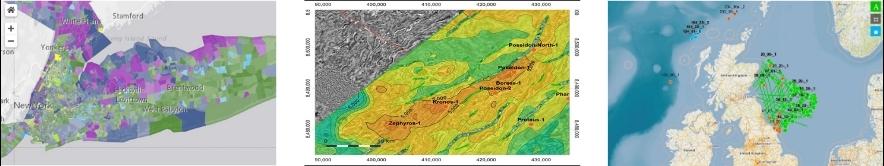
Maps
Seamlessly integrate a variety of popular WMTS services, including Google, Esri, MapQuest, ArcGIS GeoServices, OpenStreet Map, and more.
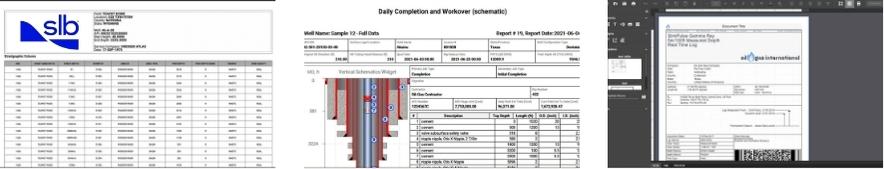
Report builder
Create PDF reports with multiple widgets, minimizing the time it takes to build custom log headers. Integrate a custom application and connect to data. Available as a ready-to-go add-on, or you can code your solution by hand. The Report Builder library is available in JavaScript/TypeScript.
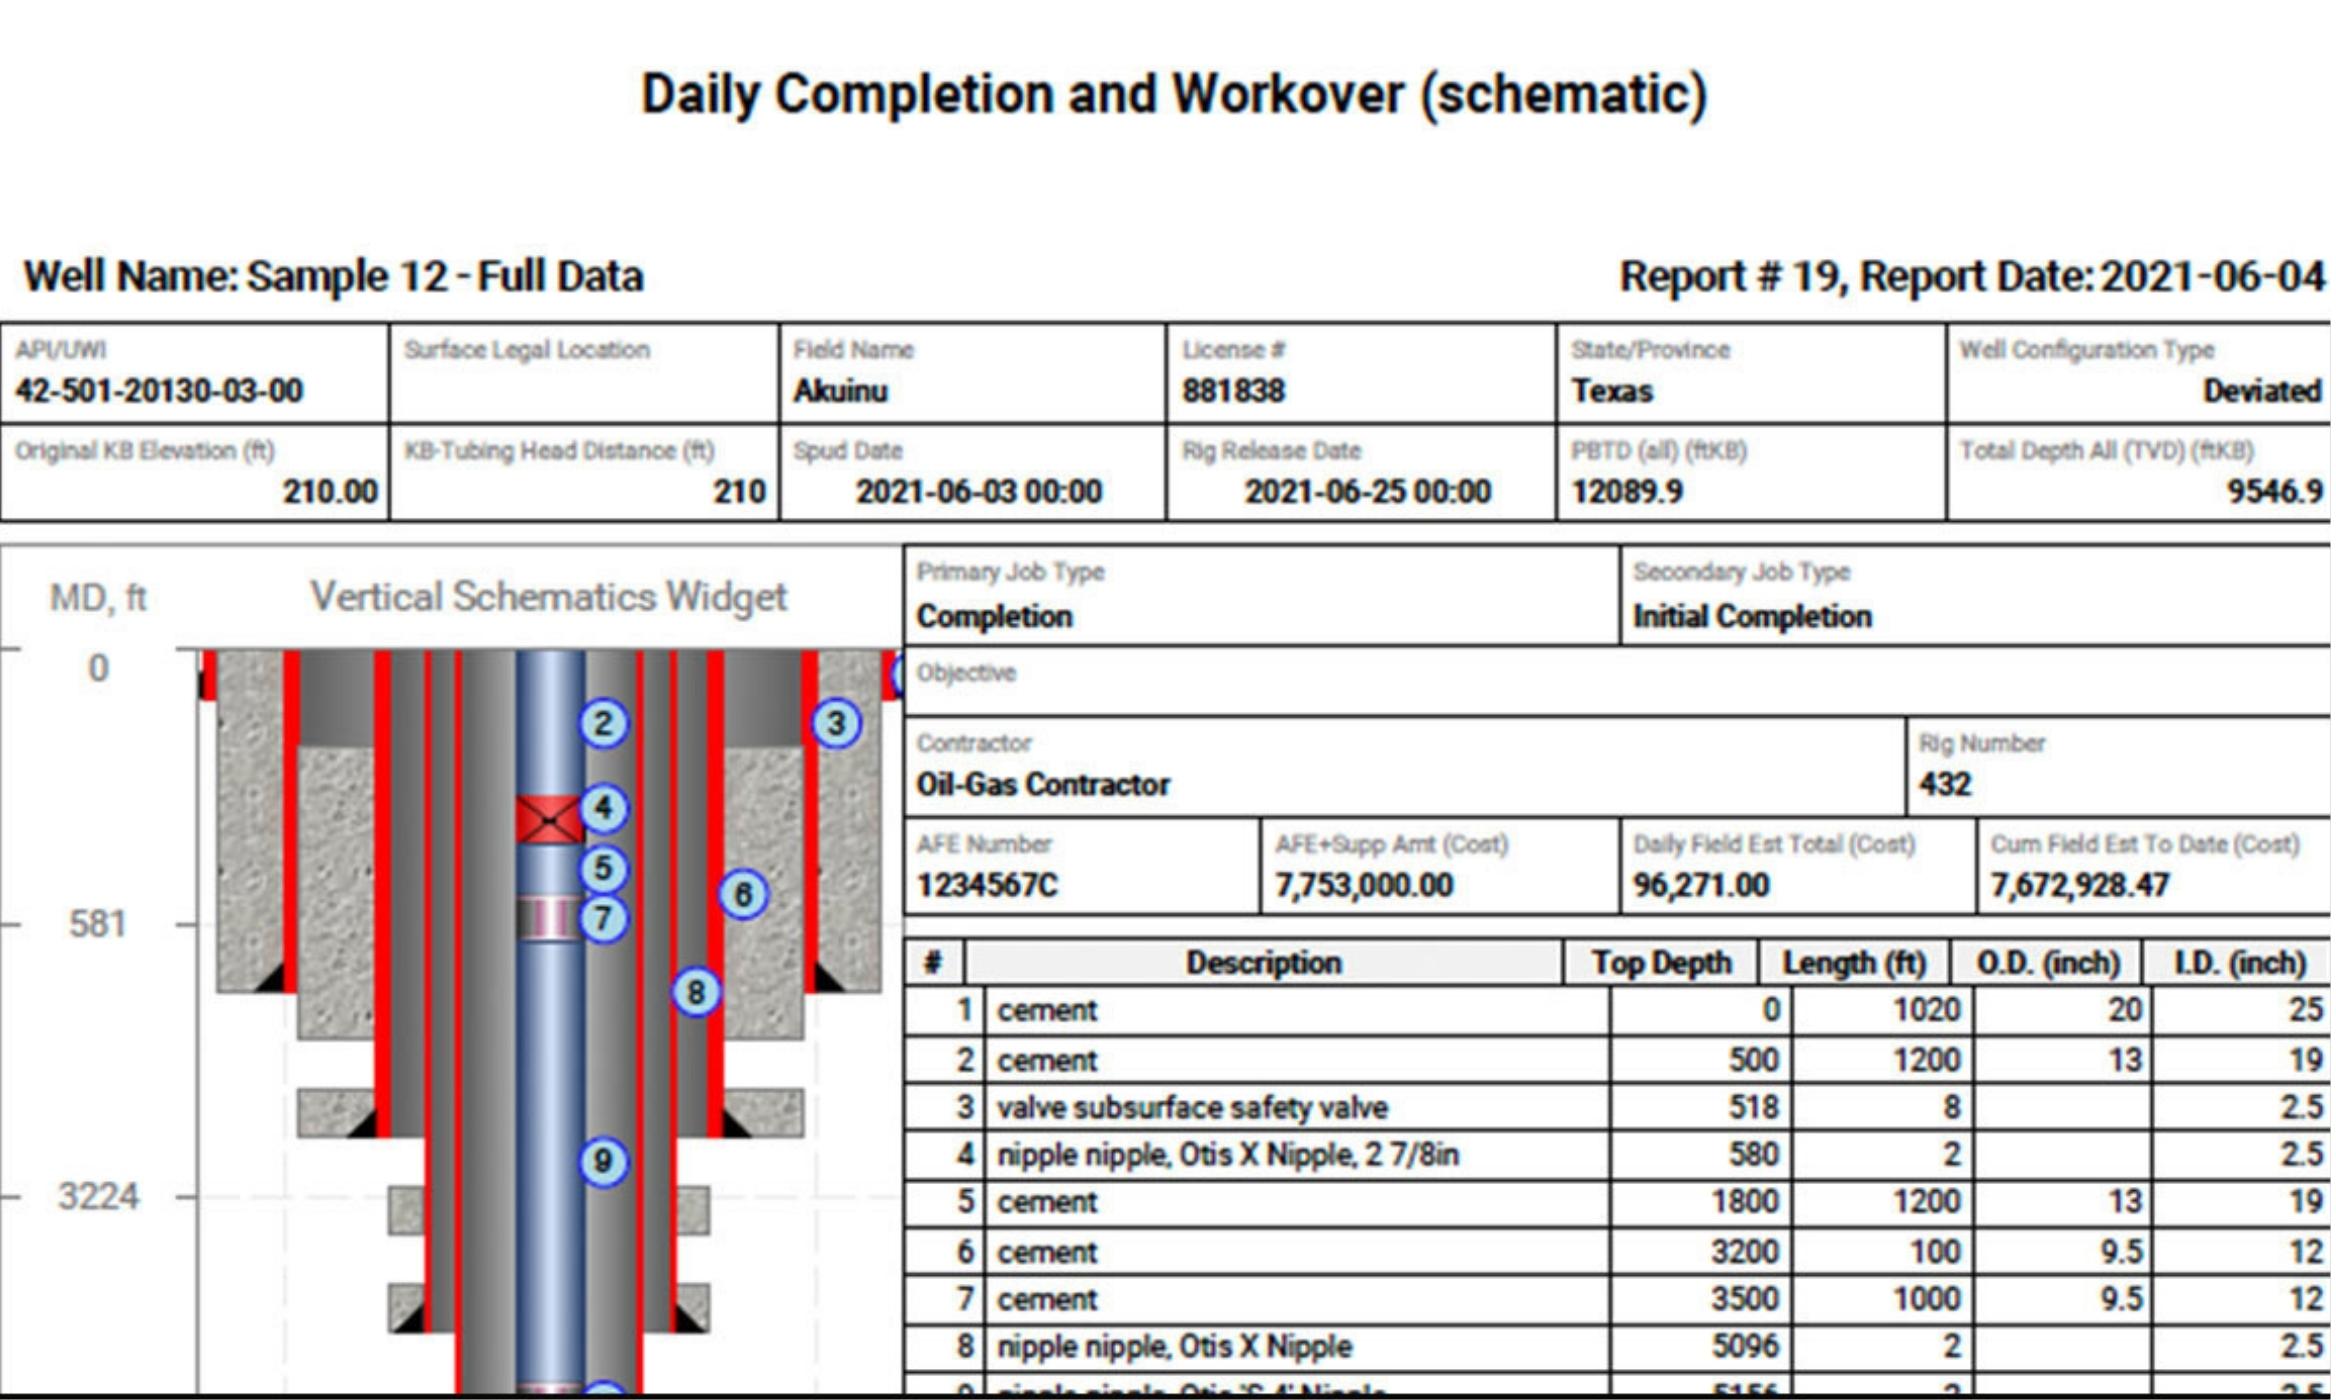
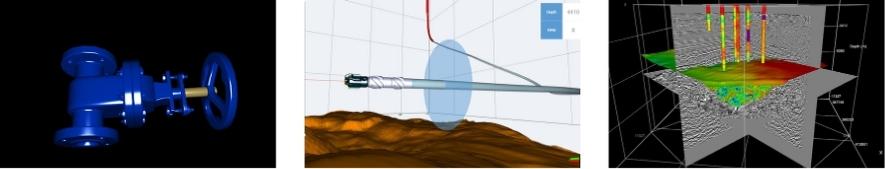
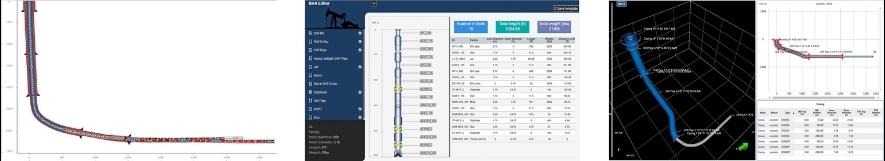
Well schematics
Visualize wellbore, downhole equipment, including drilling, completion, production, and workover operations. Display and edit BHAs and vertical, deviated, multilateral, and horizontal wells.
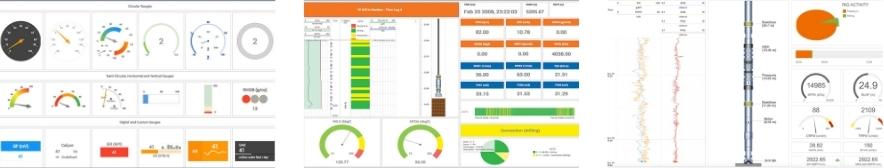
Gauges and alarms
Combine textual, radial, and linear gauge types with alarms to notify users when values reach pre-defined thresholds in real-time monitoring applications.
Contours
Display a gridded or triangulated surface as a contour. Customize the frequency and appearance of contours, annotations, and colors.
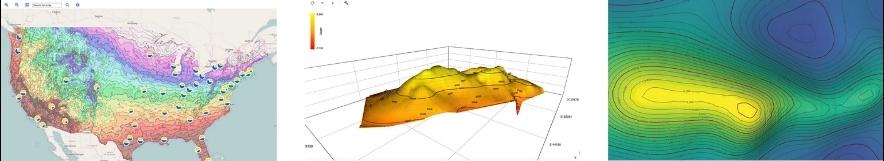
Charts and maps
Create stunning charts, graphs, and maps with minimal programming effort with our extensive set of samples and tutorials. Extend existing charts or create new ones through a powerful API.
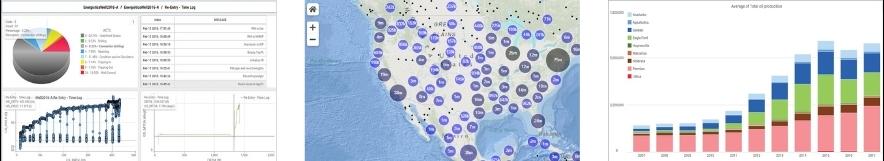
Time series
Visualize multiple time series data with annotations and overlays for easy correlation and analysis in normal, stacked, or percentage mode. The TimeSeries library is available in JavaScript/TypeScript.
GeoToolkit libraries demo gallery
The GeoToolkit Demo Gallery is your hands-on reference for building high-performance geospatial visualizations. Each demo is a working example. Whether you're rendering large-scale well log data, building interactive map layers, or compositing multi-panel dashboards, the gallery is the fastest way to understand what's possible and how to get there.
Benefits
Why GeoToolkit libraries?
The libraries behind energy visualization.
Enhance your energy applications with our flexible data visualization libraries or build powerful, custom solutions from scratch.
Get the support you need with online documentation and our dedicated technical support team.
Supports for most subsurface data types, including LAS, DLIS, WITSML, SEG-Y, SEG-D, and more.
GeoToolkit energy visualization libraries
GeoToolkit energy visualization libraries are a powerful suite of high-performance components, designed for developers seeking to rapidly build or extend advanced geoscience visualization software.
Features
Build your way
With GeoToolkit libraries and widgets, you have the flexibility to either simply plug and play high-performance functionality with one line of code or build an application from scratch, selecting and customizing libraries to fit your needs.
Discover the latest GeoToolkit energy visualization libraries.
FAQ | Find answers to common questions about GeoToolkit libraries
What is GeoToolkit libraries?
GeoToolkit is a comprehensive set of high-performance 2D/3D tools and libraries used in subsurface software applications to display seismic, log, schematic, contour, real-time data, and more. GeoToolkit libraries components allow developers to build advanced domain-oriented software and applications in the cloud quickly with low overhead and industry-leading support. GeoToolkit libraries are available in JavaScript, Python, TypeScript, Java, C++ and .Net.
Which frameworks does GeoToolkit libraries support?
GeoToolkit libraries supports Angular, React, Vue, and languages like JavaScript and TypeScript.
Which data providers can GeoToolkit libraries access?
GeoToolkit libraries can access data in INTGeoServer, IVAAP software, cloud storage, and more.
Is it cheaper to buy GeoToolkit libraries or build an application from scratch?
Developing our advanced visualization libraries took many years. We have learned from customers who shared candidly that before purchasing GeoToolkit libraries, they tried to develop and recreate similar functionalities from scratch and it took them many man-months to create basic visualization capabilities for subsurface data, costing 10 to 20x more than simply licensing GeoToolkit libraries.
Can I customize the look and feel of the libraries to match my application branding?
Yes, GeoToolkit libraries can be customized to the look and feel of your application. All the widgets can also be customized through a CSS mechanism.
Does GeoToolkit libraries support reservoir data visualizations?
Yes, we support reservoir grid visualization in 3D. INTGeoServer provides native support for standard reservoir formats such as GRDCEL, RESQML, and SEP, but it is provided through a separate license. Otherwise, there is a REST API that you can use to send the grid geometry and attributes from the server to the reservoir object directly.
How do I feed data into GeoToolkit libraries? What options do I have to consume data?
GeoToolkit libraries provides any type of connection to receive data from a specific server. You can integrate to any commercial or custom database and/or server. Data can be received in two different protocols: REST Services (INTGeoServer, etc.) or Web Sockets, normally used for real time data.
Can you read data from cloud storage?
Yes, we can read data from nearly any cloud provider—including Amazon S3, Microsoft Blob Storage, and GCP—and can access your on-premise and hybrid data as well.
Is there a limit to how many logs can be displayed in the well correlation?
There is no limit, as the mechanism to call for the data to be displayed is on-demand. We have showcased displays with 10,000 wells. GeoToolkit libraries can efficiently handle Level of Details (LOD) as you zoom in and out. Performance really depends on the user’s hardware like CPU, Graphic Card, memory, etc., but typically the limitation will depend on your ability to retrieve and serve the data to the client.
Can I combine each library into a single view?
Yes, you can mix and match components from different libraries to build a single view. Overlay or co-visualization is one of the key advantages of GeoToolkit libraries.
Designed for developers
GeoToolkit libraries power key SLB technologies such as Petrel subsurface software, the Delfi digital platform, and IVAAP energy data visualization and BI solution—and can also be integrated into third-party or custom solutions for broader flexibility.
Petrel subsurface software
Enable discipline experts to work together and make the best possible decisions from exploration to production.
Delfi digital platform
Open, scalable, and secure, cloud-based software environment with 24/7 operational support.
IVAAP energy data visualization and BI solution
Unlocking subsurface insights through unified data visualization and workflow integration.

New developer documentation
Whether you’re building interactive well logs, seismic displays, or custom geospatial solutions, our documentation provides the resources you need to succeed.
Explore