IVAAP intelligent data visualization and BI for energy
Unlocking subsurface insights through unified data visualization and workflow integration

Subsurface visualization and BI for the energy industry
For energy professionals navigating the complexities of digital transition and subsurface data, IVAAP intelligent data visualization offers advanced 2D and 3D data exploration, discovery, visualization, and analysis capabilities integrated with a powerful user interface (UI) to build custom dashboards. With robust SDKs and APIs, along with full OSDU® Data Platform interoperability, IVAAP empowers rapid, informed decision-making.
Built to increase efficiency and reduce time to interpretation, IVAAP simplifies complex subsurface data visualization, connecting seamlessly with existing systems and streamlining workflows across teams.
Real-time drilling and analysis
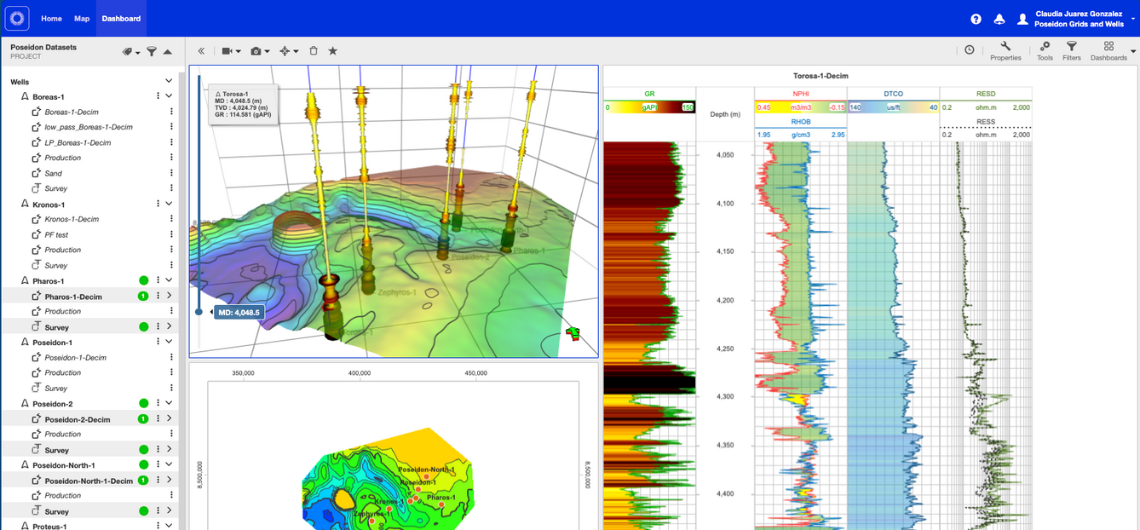
Cloud-based digital applications gain a new dimension with real-time data visualization capabilities in IVAAP. Harness the power of your WITSML™ server and other production and drilling data sources in one place—offset well databases, real-time data, and geological and geophysical data converge. This isn't just data; it's insight. Users can build interactive dashboards, crafting dynamic displays of time- and depth-based data. From well logs and surveys to BHA and drill-string components, crossplots, and pie charts, IVAAP helps you transform raw data into actionable knowledge.
Accelerated AI insights: visual quality control and integration
AI and machine learning (ML) are reshaping subsurface exploration. The goal: Uncover better opportunities, faster. But without proper visualization, those opportunities remain hidden. IVAAP bridges that gap, enabling you to visually explore and select critical geophysical, petrophysical, and production data, then launch your analytics and see the outcomes, all in one place. Connect your data science, automate tedious tasks, and build ML models that deliver real results. IVAAP integrates with your ML service, making your data work for you.
OSDU® Data Platform visualization and interoperability
SLB is committed to the OSDU® Data Platform vision. With IVAAP, geoscientists and engineers can unlock the full potential of their seismic, well log, and production data directly on the OSDU® Data Platform. Drawing on decades of visualization expertise, IVAAP delivers advanced data exploration and visualization, empowering users to search, explore, and quality control critical subsurface data. IVAAP offers open and extensible architecture to ensure future integration and compatibility with emerging technologies, allowing your subsurface workflows to evolve alongside industry advancements. This is more than seeing data; it's about making it actionable now and in the future.
Leverage powerful visualization anywhere
Exploration
- Quickly visualize and analyze large datasets (seismic surveys, well data) across basins to identify potential exploration areas.
- Integrate seismic interpretations, well logs, and geological maps in 3D to define and evaluate prospects.
- Visualize reservoir geometries and property distributions to estimate potential hydrocarbon volumes.
- Overlay various datasets to assess the likelihood of successful hydrocarbon accumulations.
Well planning and drilling
- Monitor and visualize streaming drilling data (WITSML) alongside planned well paths and subsurface models to make informed decisions during drilling operations.
- Plan and visualize optimal well paths in 3D, considering geological targets, fault zones, and existing infrastructure.
- Visualize real-time MLWD data in relation to geological targets to optimize well placement within the reservoir.
- Visualize and analyze the proximity of planned wells to existing wells and other subsurface objects in 2D and 3D to mitigate collision risks.
Production and operations
- Visualize historical and real-time production data (rates, pressures, temperatures) for individual wells and fields.
- Compare and monitor the performance of multiple wells visually to identify trends and optimize production strategies.
- Visualize downhole equipment data and production rates to optimize artificial lift methods.
- Visualize injection and production data to monitor sweep efficiency and optimize waterflood patterns.
- Visualize data related to the integrity of wells, pipelines, and other assets to identify potential risks.
Data management and collaboration
- Visualize and explore data residing in the OSDU® Data Platform.
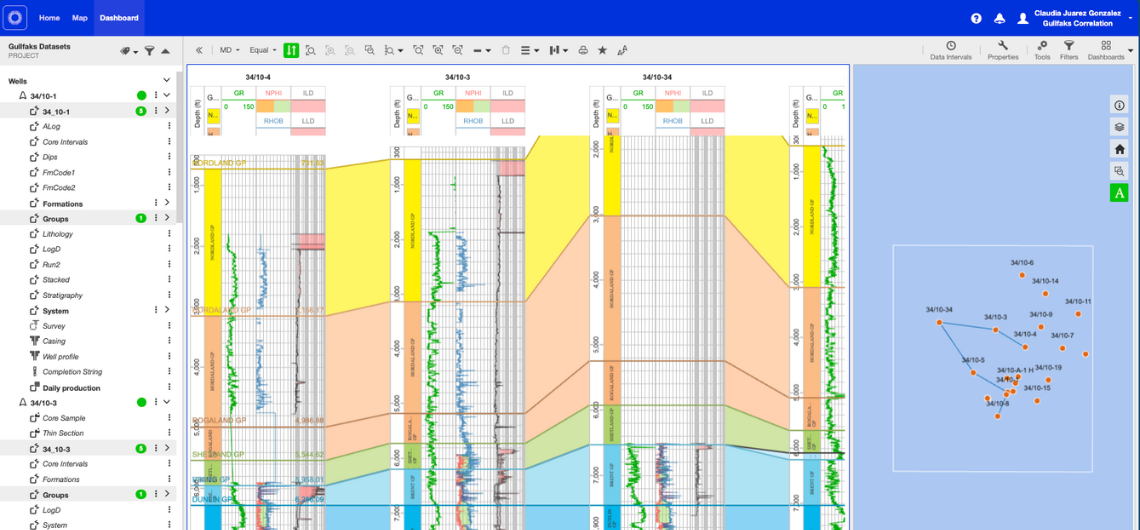
- Provide a shared 3D visualization environment for geologists, geophysicists, reservoir engineers, and drilling engineers to collaborate on projects.
- Visually inspect and screen various subsurface datasets to identify errors or inconsistencies.
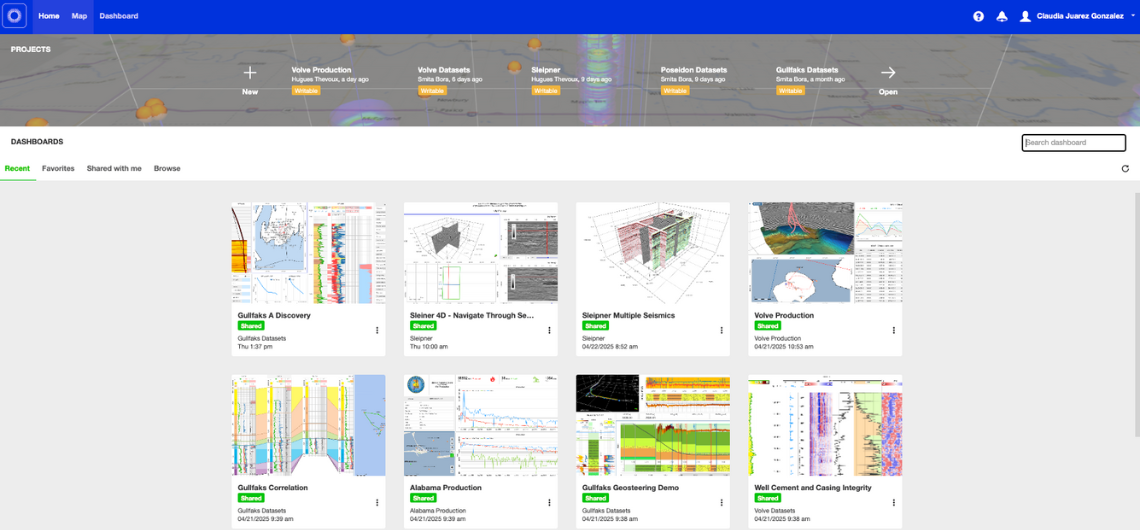
- Create compelling visualizations to communicate subsurface insights to stakeholders.
- Provide a secure environment or virtual data room (VDR) for visualizing and sharing subsurface data during asset evaluations, divestitures or licensing rounds.
Emerging applications
- Visualize subsurface formations for CO2 injection and storage monitoring.
- Visualize subsurface temperature gradients and geological structures for geothermal resource assessment.
- Visualize subsurface formations for the storage of natural gas or other commodities.
Why IVAAP solution?
Building bridges to openness and adaptability.
Integrate diverse subsurface data types into a unified visualization platform.
Simplify data analysis and interpretation workflows with a single interface.
Accelerate data exploration to quickly identify key insights.
Enhance data reliability for confident decision-making with reduced uncertainty.
Connect and visualize data from various E&P applications and data sources seamlessly.
Export visualizations and data for streamlined reporting and collaboration.
Reliable data visualization solution
IVAAP provides a comprehensive and unified view of diverse subsurface data. It connects seamlessly to various data sources like OSDU® Data Platform and WITSML, eliminating data silos and enabling active data analysis through intuitive dashboards, filtering options, and real-time streaming.
Discover the latest in IVAAP energy data visualization and BI solution.