SurfaceSafe
Digital drilling monitoring solutions
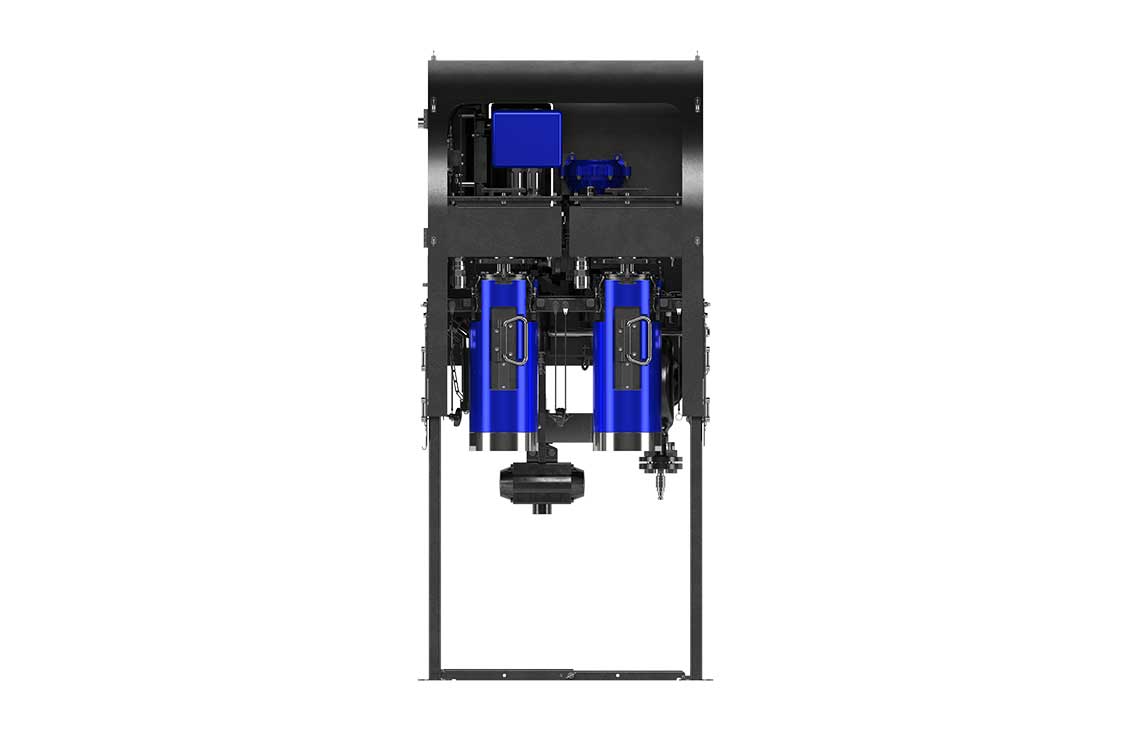
Intelligent and streamlined surface logging system for monitoring and analyzing drilling operations.

The potential for encountering abnormal formation pressure—leading to kicks, mud losses, and other well control challenges— is always present during drilling. These risks are especially challenging in complex drilling applications, such as wildcat exploration wells, deep gas wells, deepwater wells with narrow mud-weight windows, HPHT wells, and nonvertical and extended-reach wells.
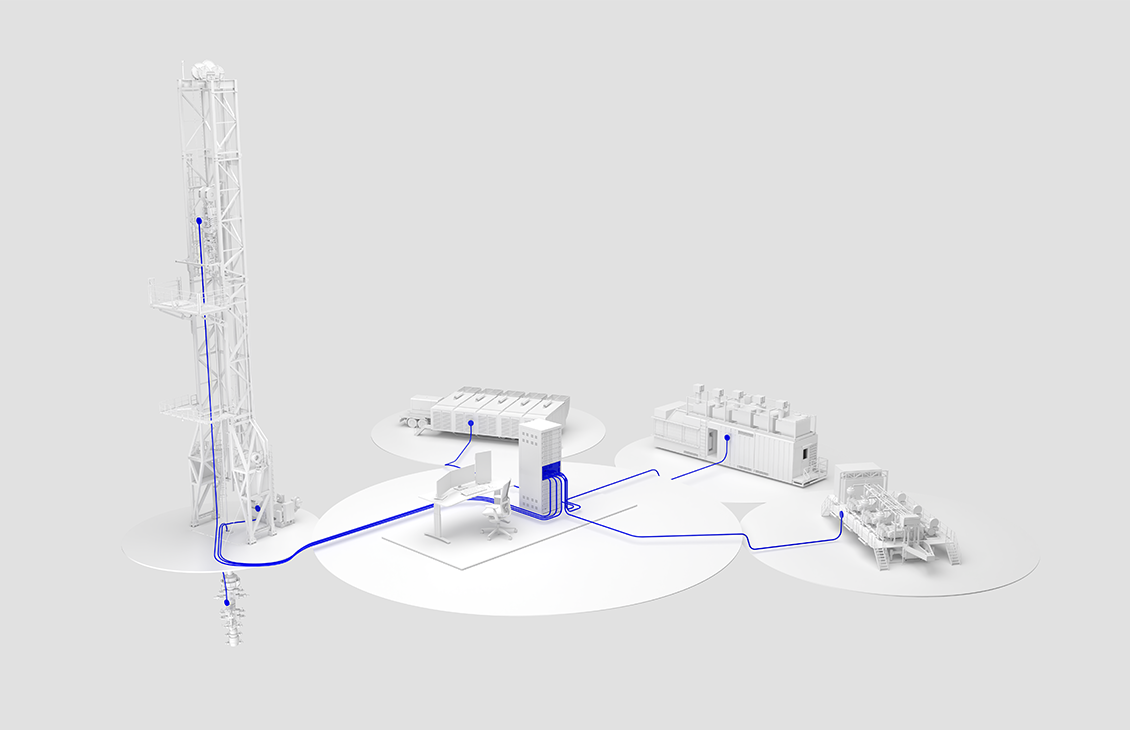
The PreVue pore pressure analysis service minimizes these risks by providing real-time monitoring of pore pressure and fracture gradients using LWD (gamma ray, resistivity, and sonic), MWD (annular pressure while drilling), drilling (ROP, torque), and gas (C1–C5) measurements including caving monitoring and interpretation.
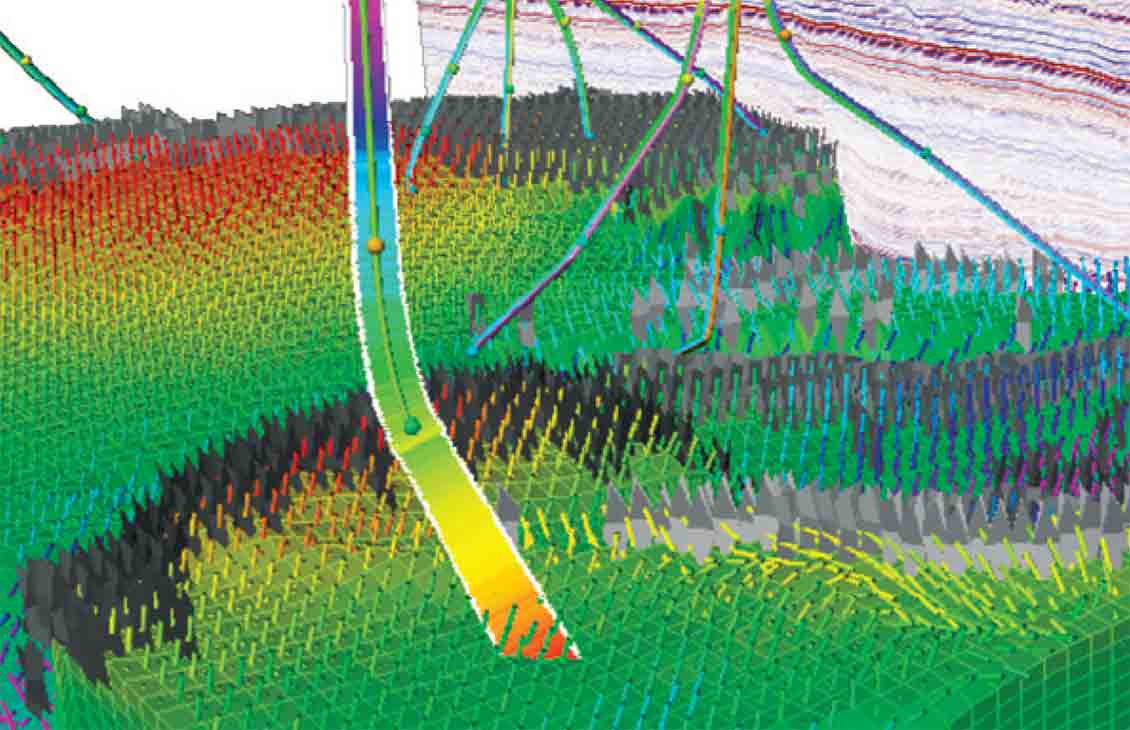
During well planning, pore pressure experts examine offset data such as basin models, results from leakoff tests (LOTs), engineering and geological reports, seismic data, well logs, and mud weights. They use this information and corrected d-exponent analysis to model the pore pressures likely to be encountered along the proposed wellbore trajectory. Potential hazards are identified and analyzed, and contingency plans are recommended.
During drilling, engineers provide a 24/7 service at the wellsite, using real-time pressure monitoring software, evaluating data, and adjusting the predrill model for accurate estimation of pore pressure, fracture gradient, and overburden. Interpretations and recommendations are communicated to key decision makers at the wellsite and in the office. Remotely based interpretation experts provide additional support to the wellsite and customer teams as required through in-depth analysis of the daily reports submitted by the wellsite engineers.