GeoToolkit new features
Explore all features free for 30 days

GeoToolkit.JS 2025.2 now available
Enhancements to GeoToolkit.JS 2025.2 push the envelope of advanced data visualization, enabling users to build, share, and consume domain-specific libraries with greater efficiency and interoperability.
GeoToolkit.JS 2025.2 highlights
Advanced charting
Improved chart controls, including flexible legend placement, scrollable time‑series legends, and faster rendering.
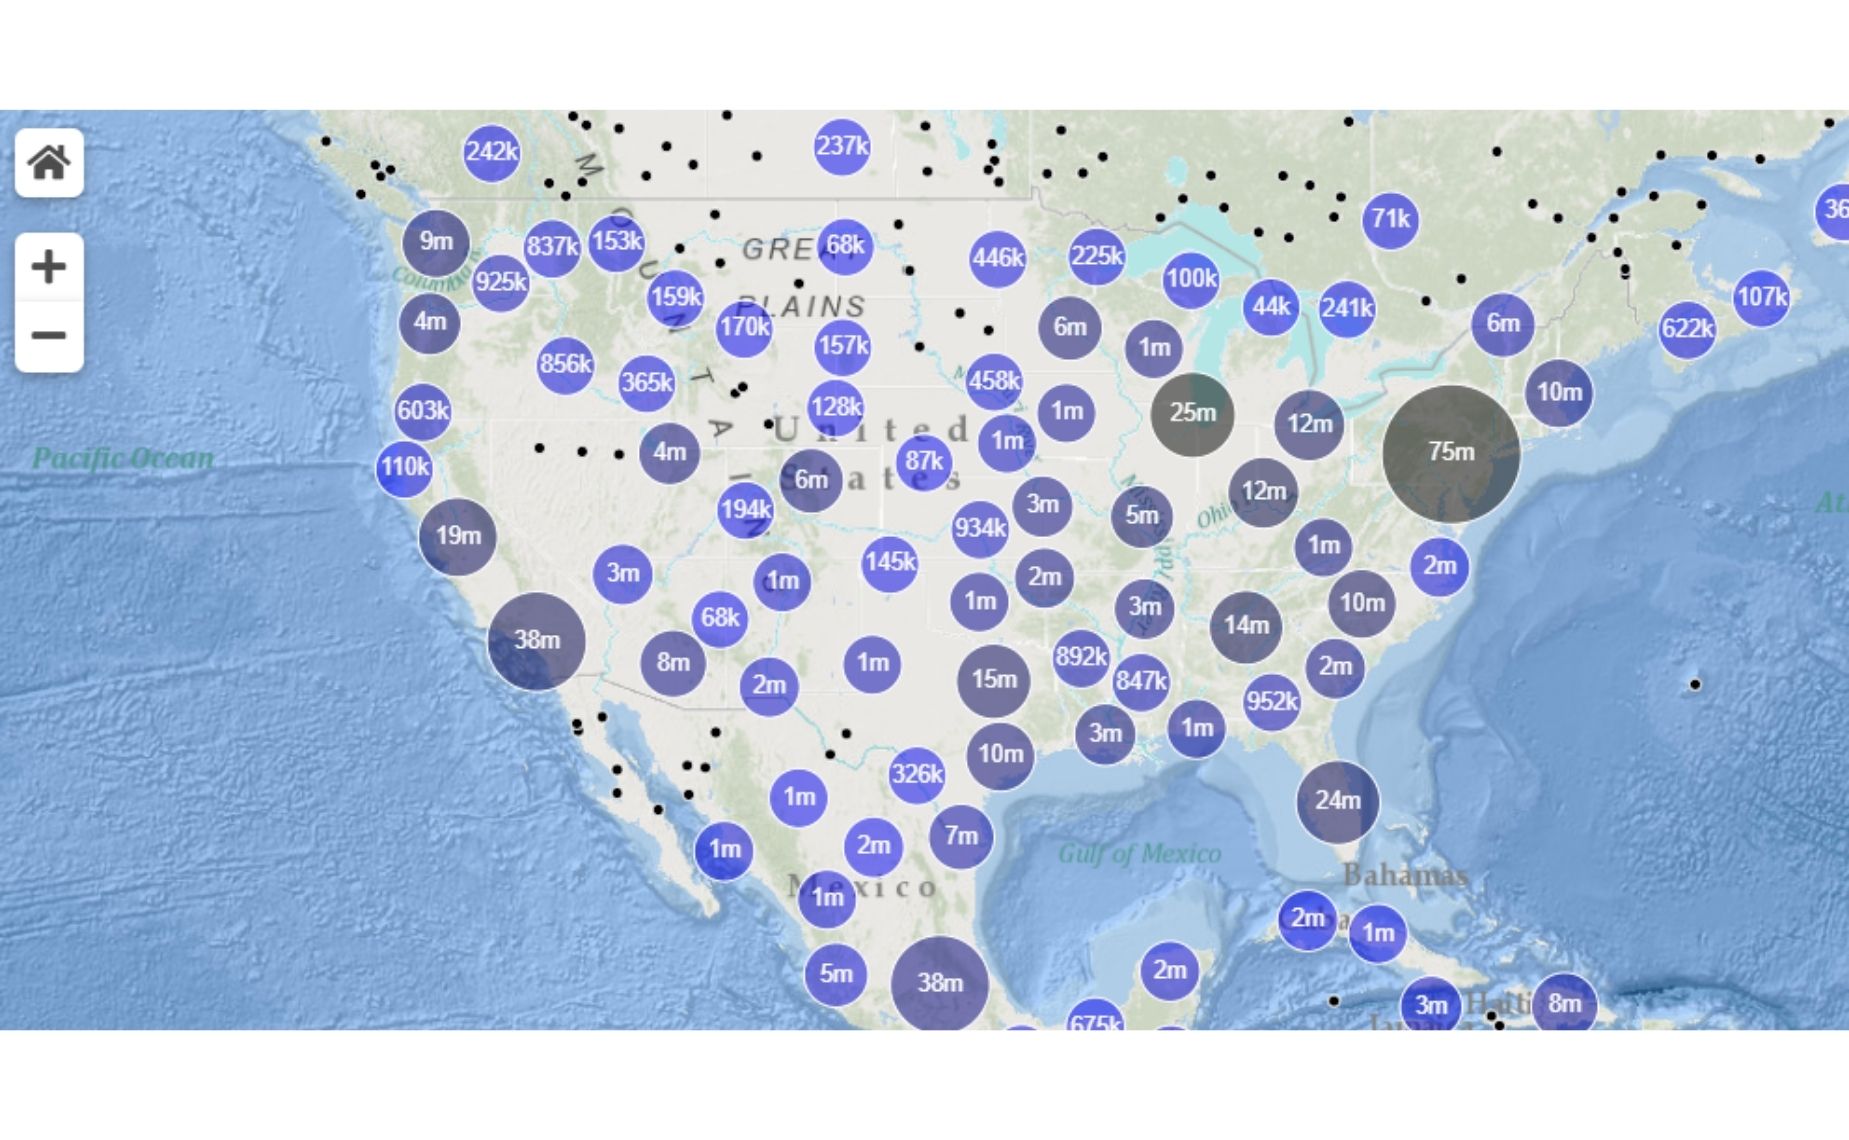
Map module enhancements
Now with map previews, Google Maps support, computed features, new widget events, and filtering tutorials.
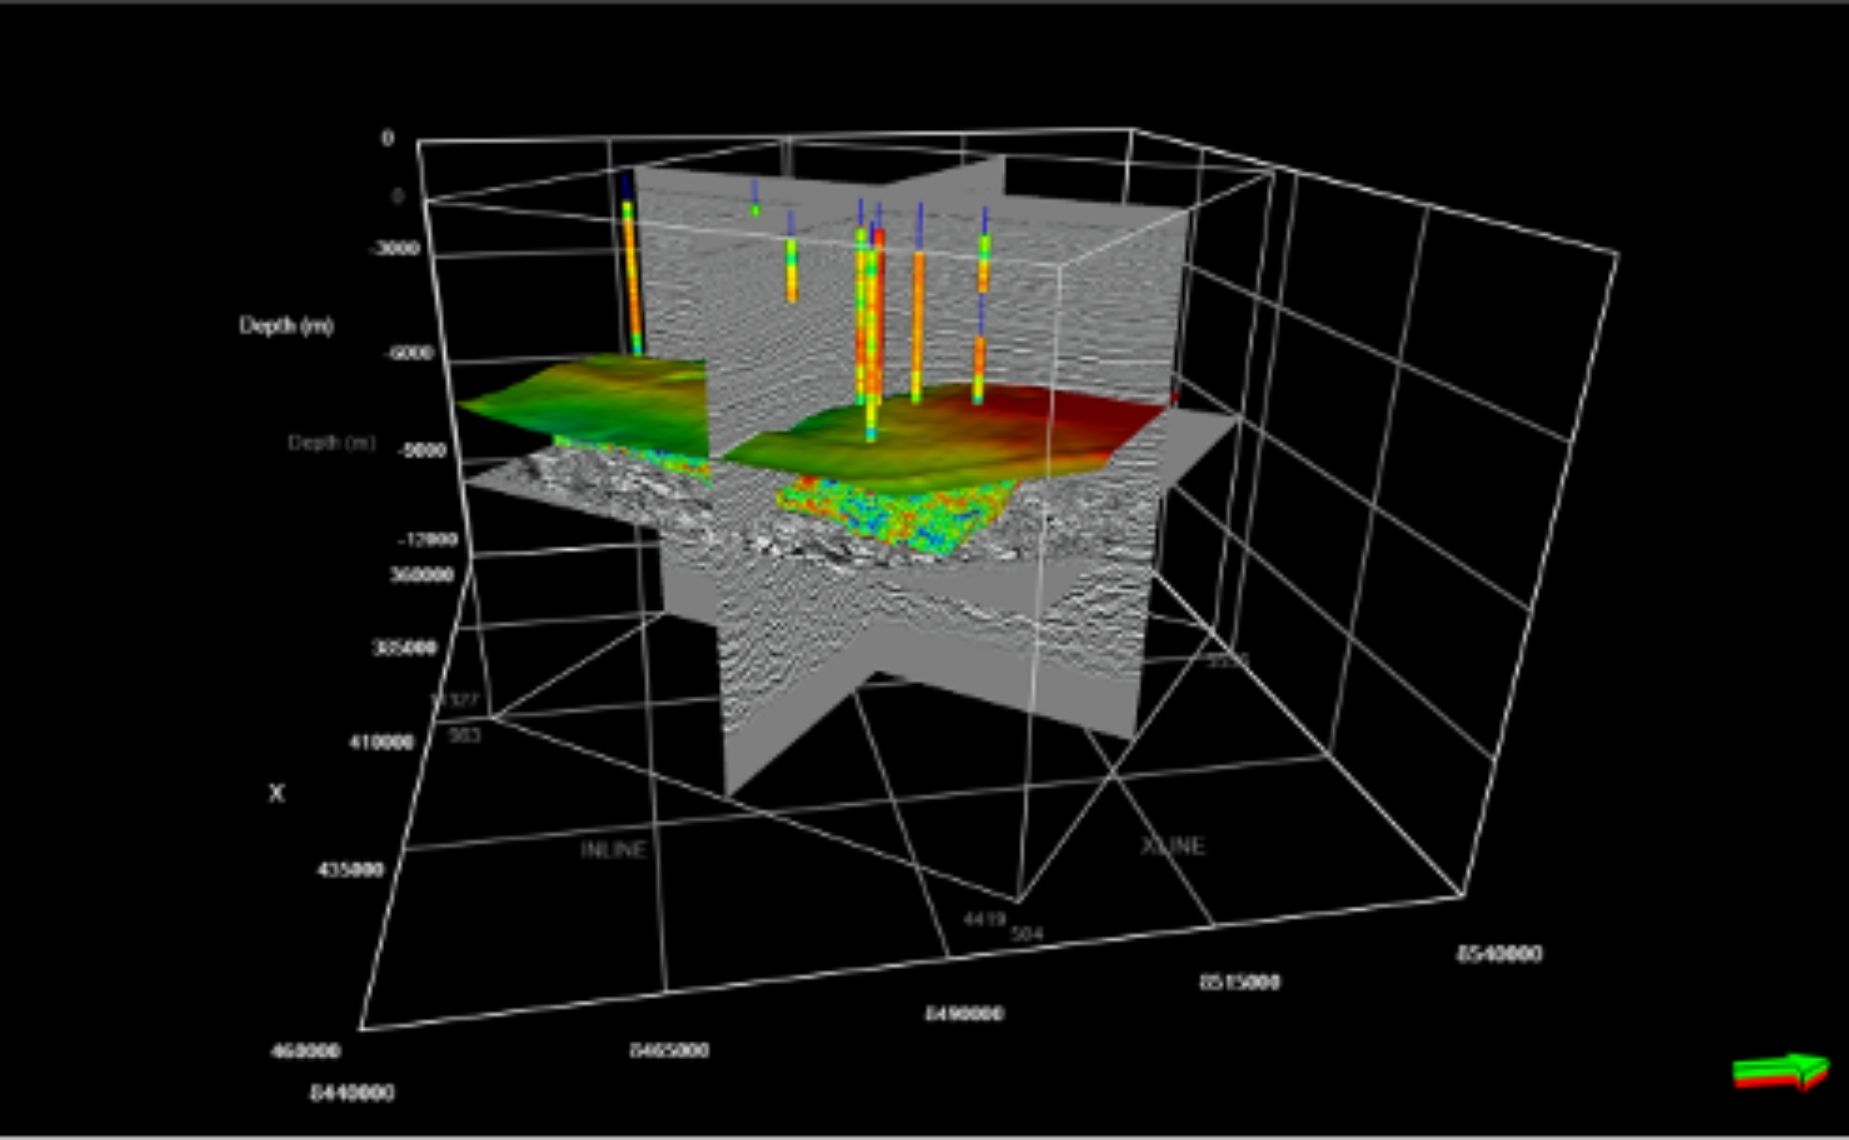
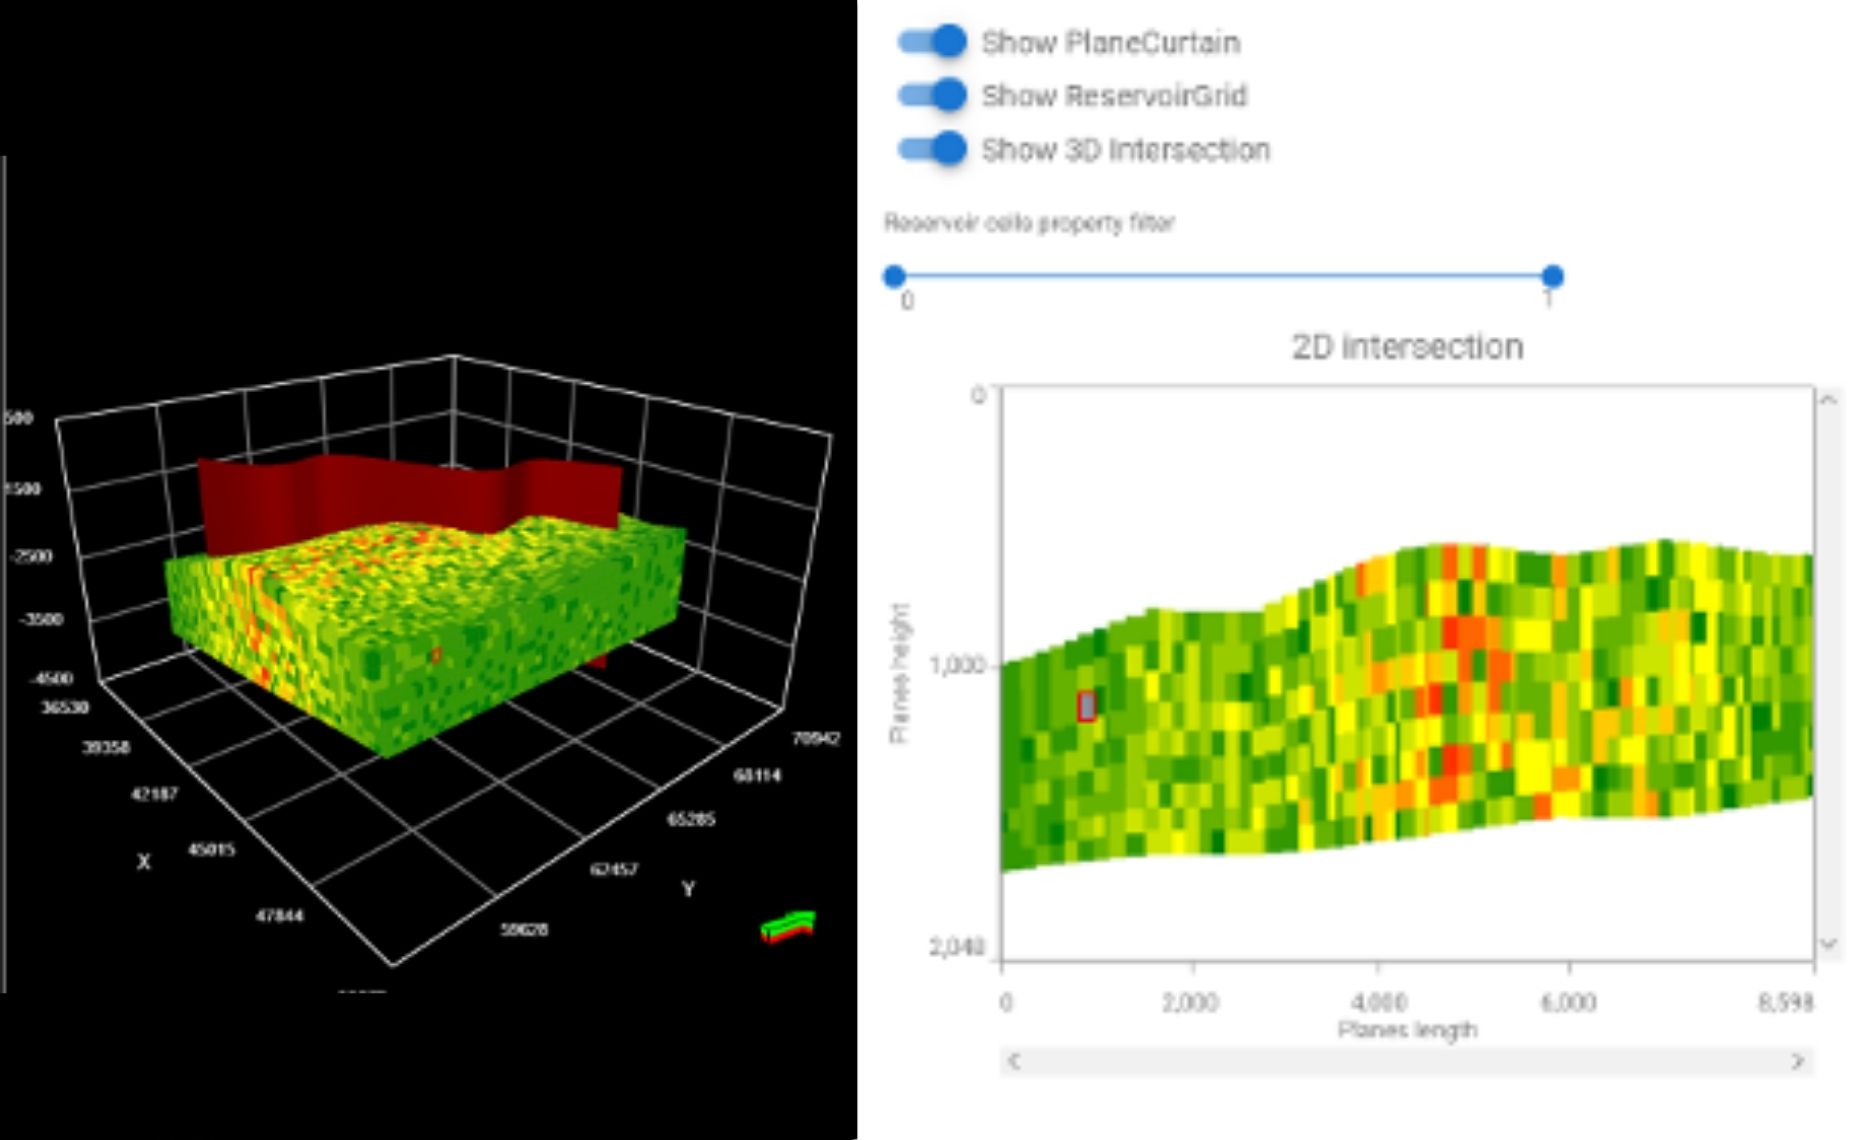
2D intersection visualization
Enabled 2D display of intersections between 3D objects such as reservoirs and seismic fences.
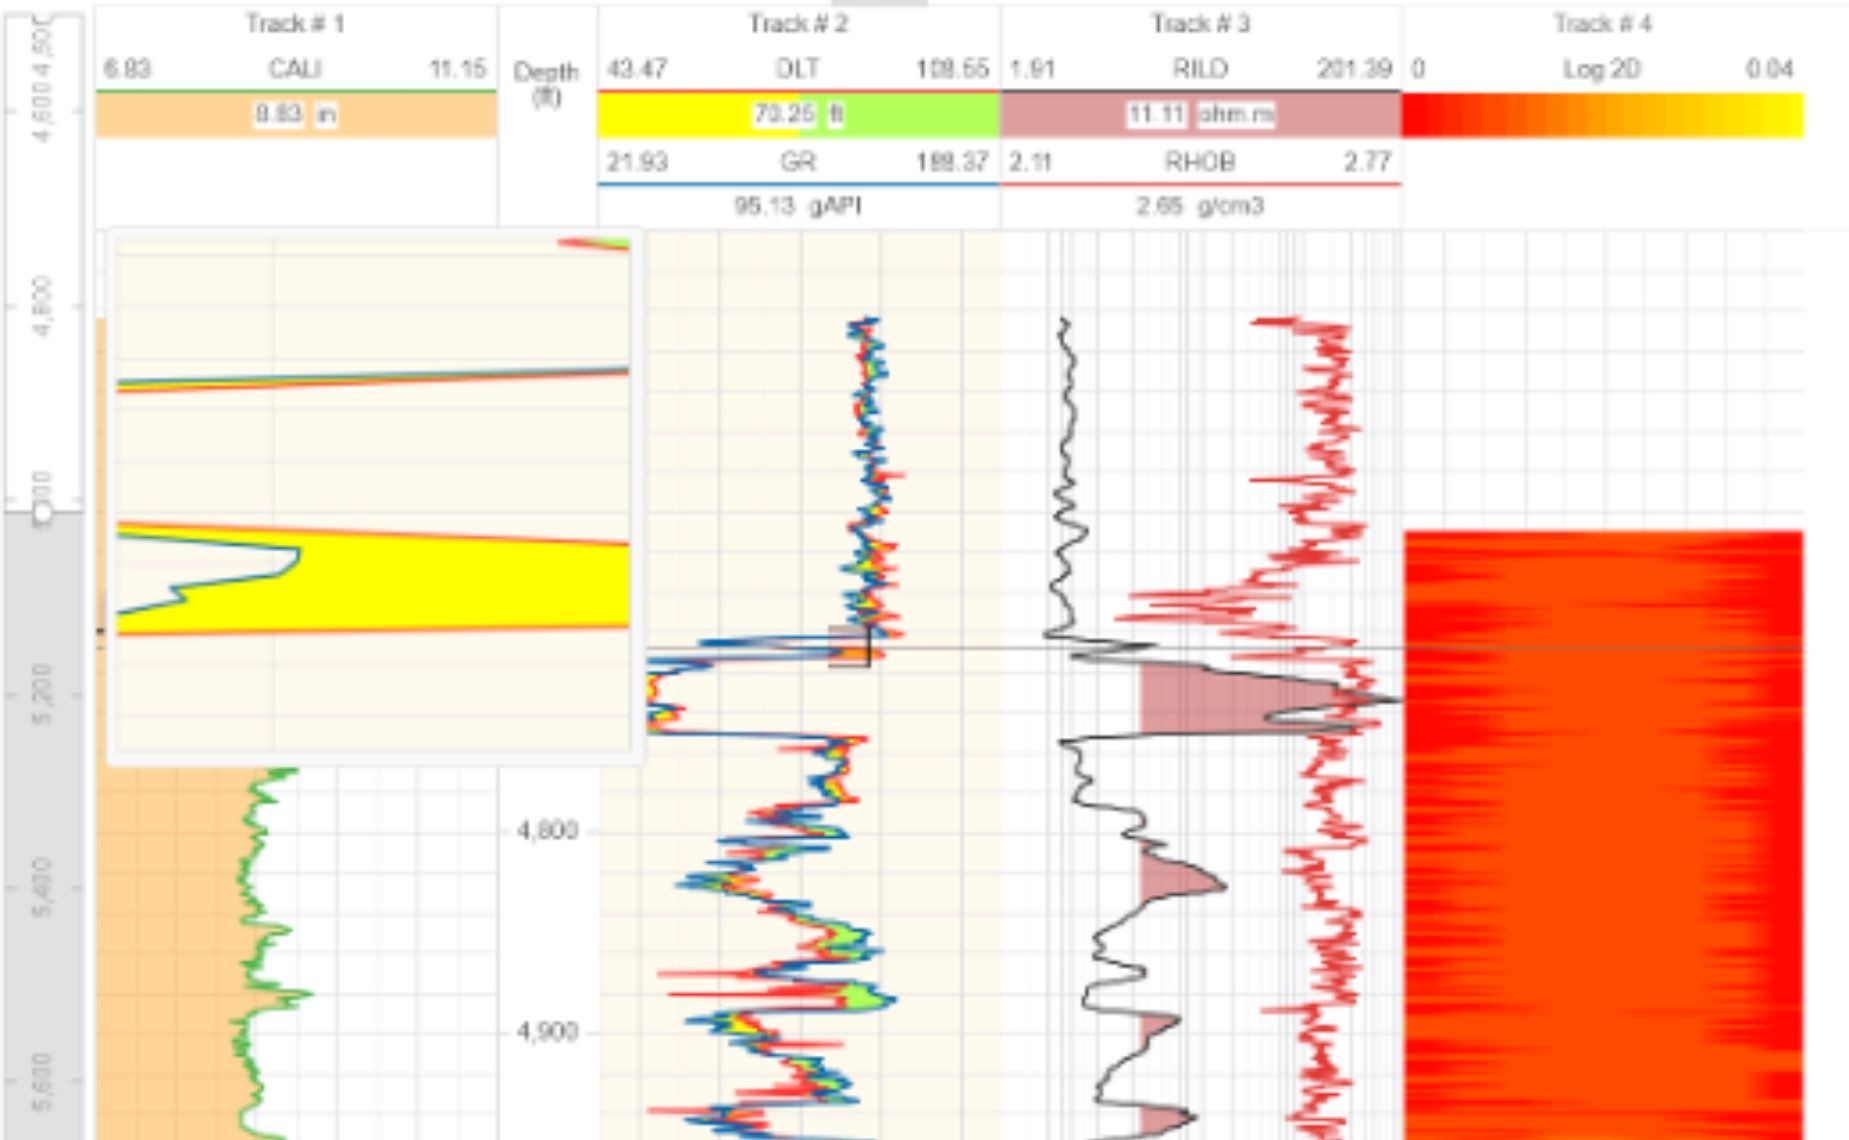
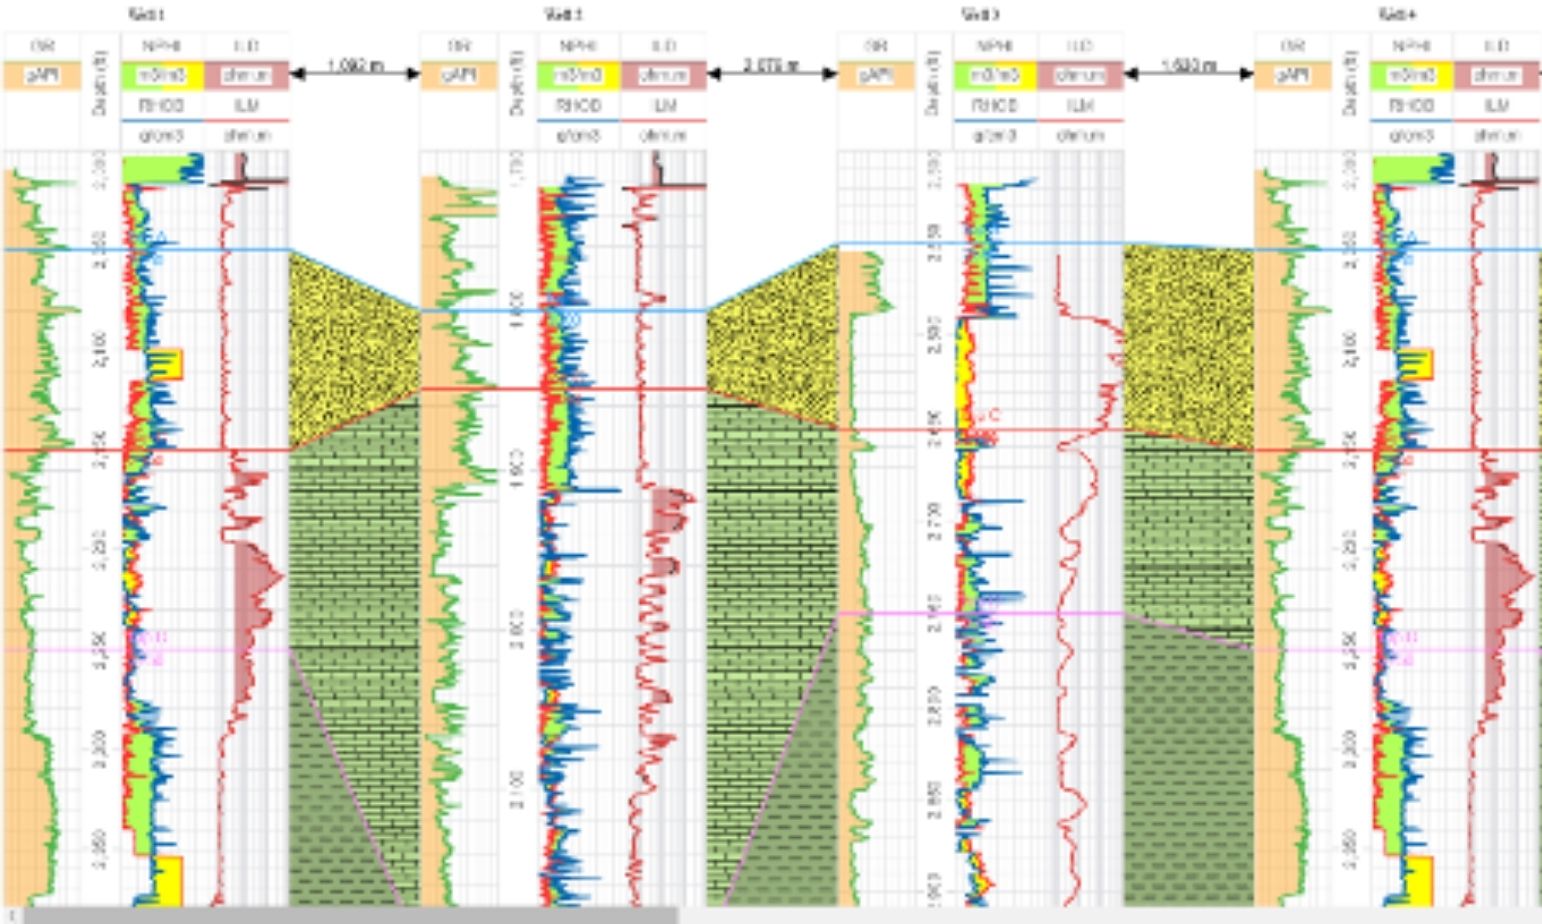
WellLog enhancements
Optimized array log performance, improved marker and zone correlation, and a new magnifier tool.
Additional release information
GeoToolkit 2025.2
Core (Carnac)
- Visualization of intersection of different 3D objects like reservoir and seismic fence in 2D.
- API to support back layer and overlays to composite nodes.
Charts
- Scrollable legend to TimeSeries Widget.
- API to change legend positions.
- Improved infinite axes mode.
Maps
- Map preview to Map widget.
- TwoPointRectangle editor (creates rectangle by two points).
- Filtering tutorials.
- Extra Map widget events.
- Google map support.
- Computed features and expression support.
WellLog
- Core enhancements
- Optimized rendering of array log (Log2D visual).
- Magnifier tool.
- Improved discrete curve to support gaps and cut off.
- Improved tick curve to filter overlapped values and provide new header.
- Displaying title headers for inner tracks.
- Correlation
- Improved automatic correlation logic for markers and zones.
- Aggregated events on MultiWellWidget to listen on depth scale changes.
Seismic
- Custom trace status support for seismic pipeline.
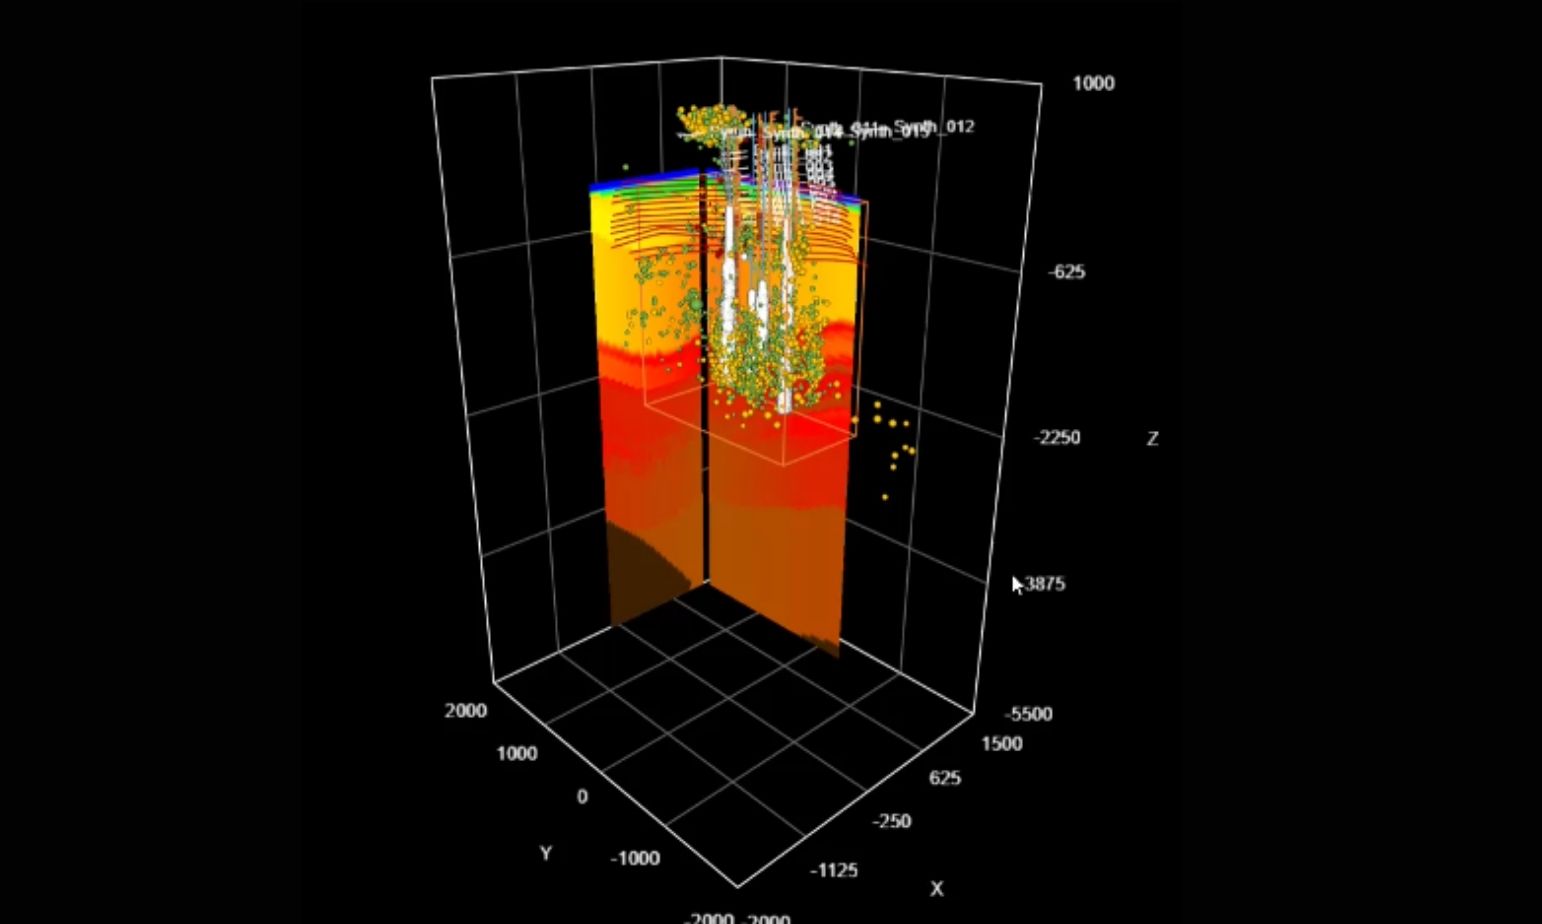
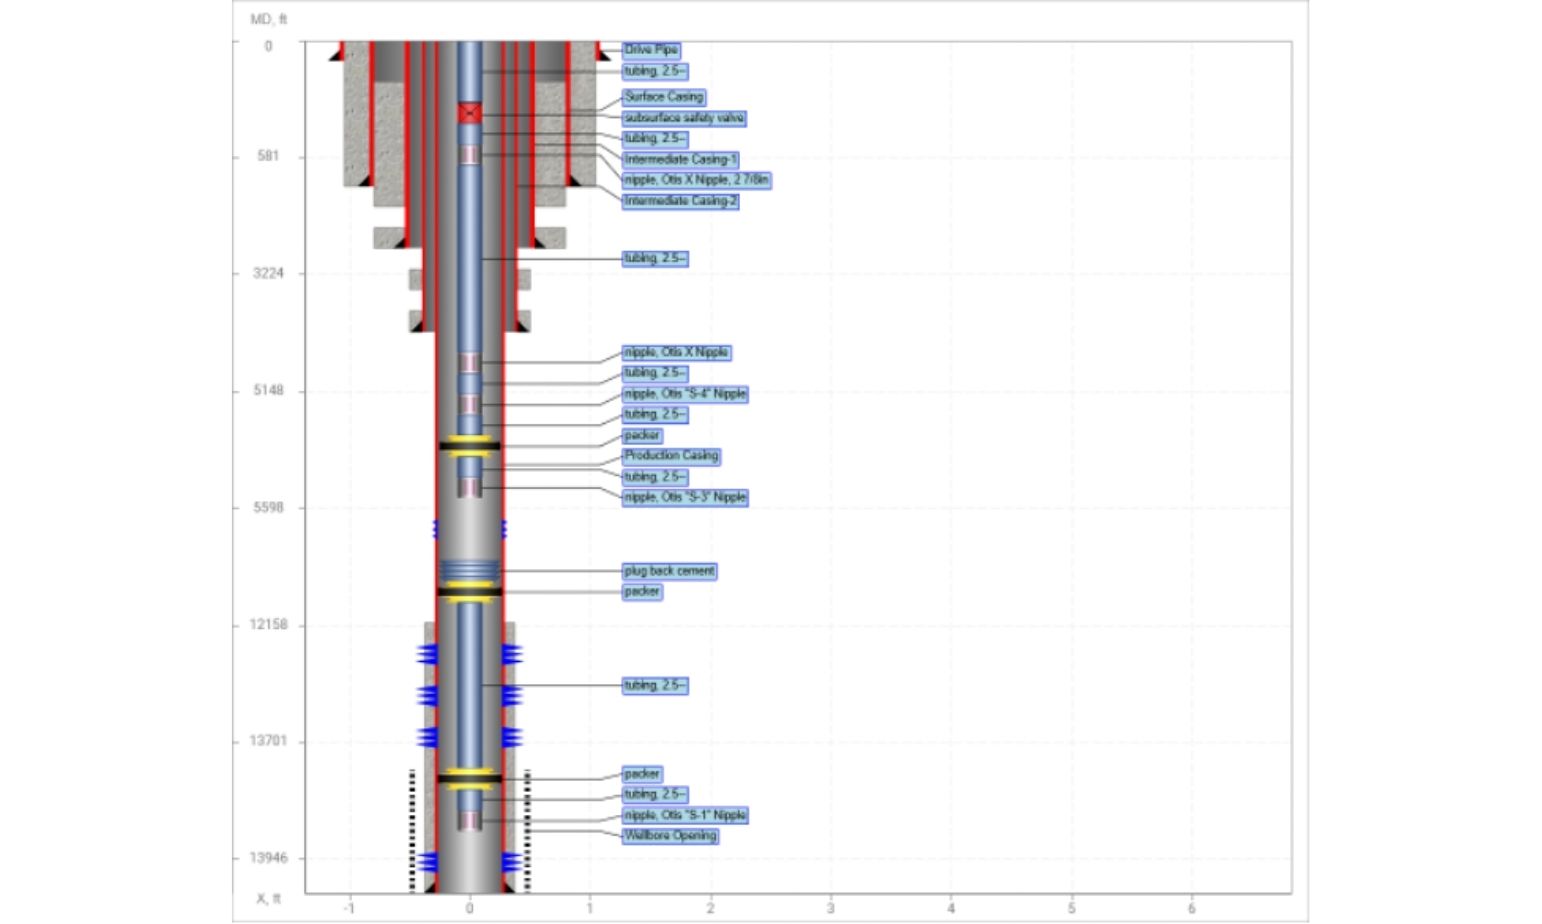
3D
- New demos: 3D schematics, micro seismic.
- API to update data for reservoir grid.
- API to highlight of reservoir grid cells.
- Improved intersection API to return cell indices.
- Improved LineSegments endcaps rendering when segments are very small.
- Improvements to depthBuffer accuracy when using linear depth buffer.

The libraries behind energy visualization
Unlock the power of advanced domain tools and libraries. GeoToolkit delivers high-performance 2D/3D rendering, real-time data integration, customizable visual components and more—ready to accelerate your digital workflows.
Request a demo