GeoToolkit energy visualization libraries
Empowering high-performance data visualization applications

Easy application development through efficient, domain-specific libraries.
GeoToolkit energy visualization libraries are a powerful suite of high-performance components, designed for developers seeking to rapidly build or extend advanced geoscience visualization software. Your developers can use the libraries to create stunning seismic displays, well logs, schematics, contour maps, charts, and more with ease.
Deploy faster
GeoToolkit's libraries are designed for speed and flexibility. Whether you need a quick plug-and-play solution or want to build a custom application from the ground up, they help you get your custom apps to market faster.
Build it your way
Develop your industrial applications using a wide range of programming languages, including JavaScript, TypeScript, .NET, Java, and C++.
GeoToolkit libraries at a glance
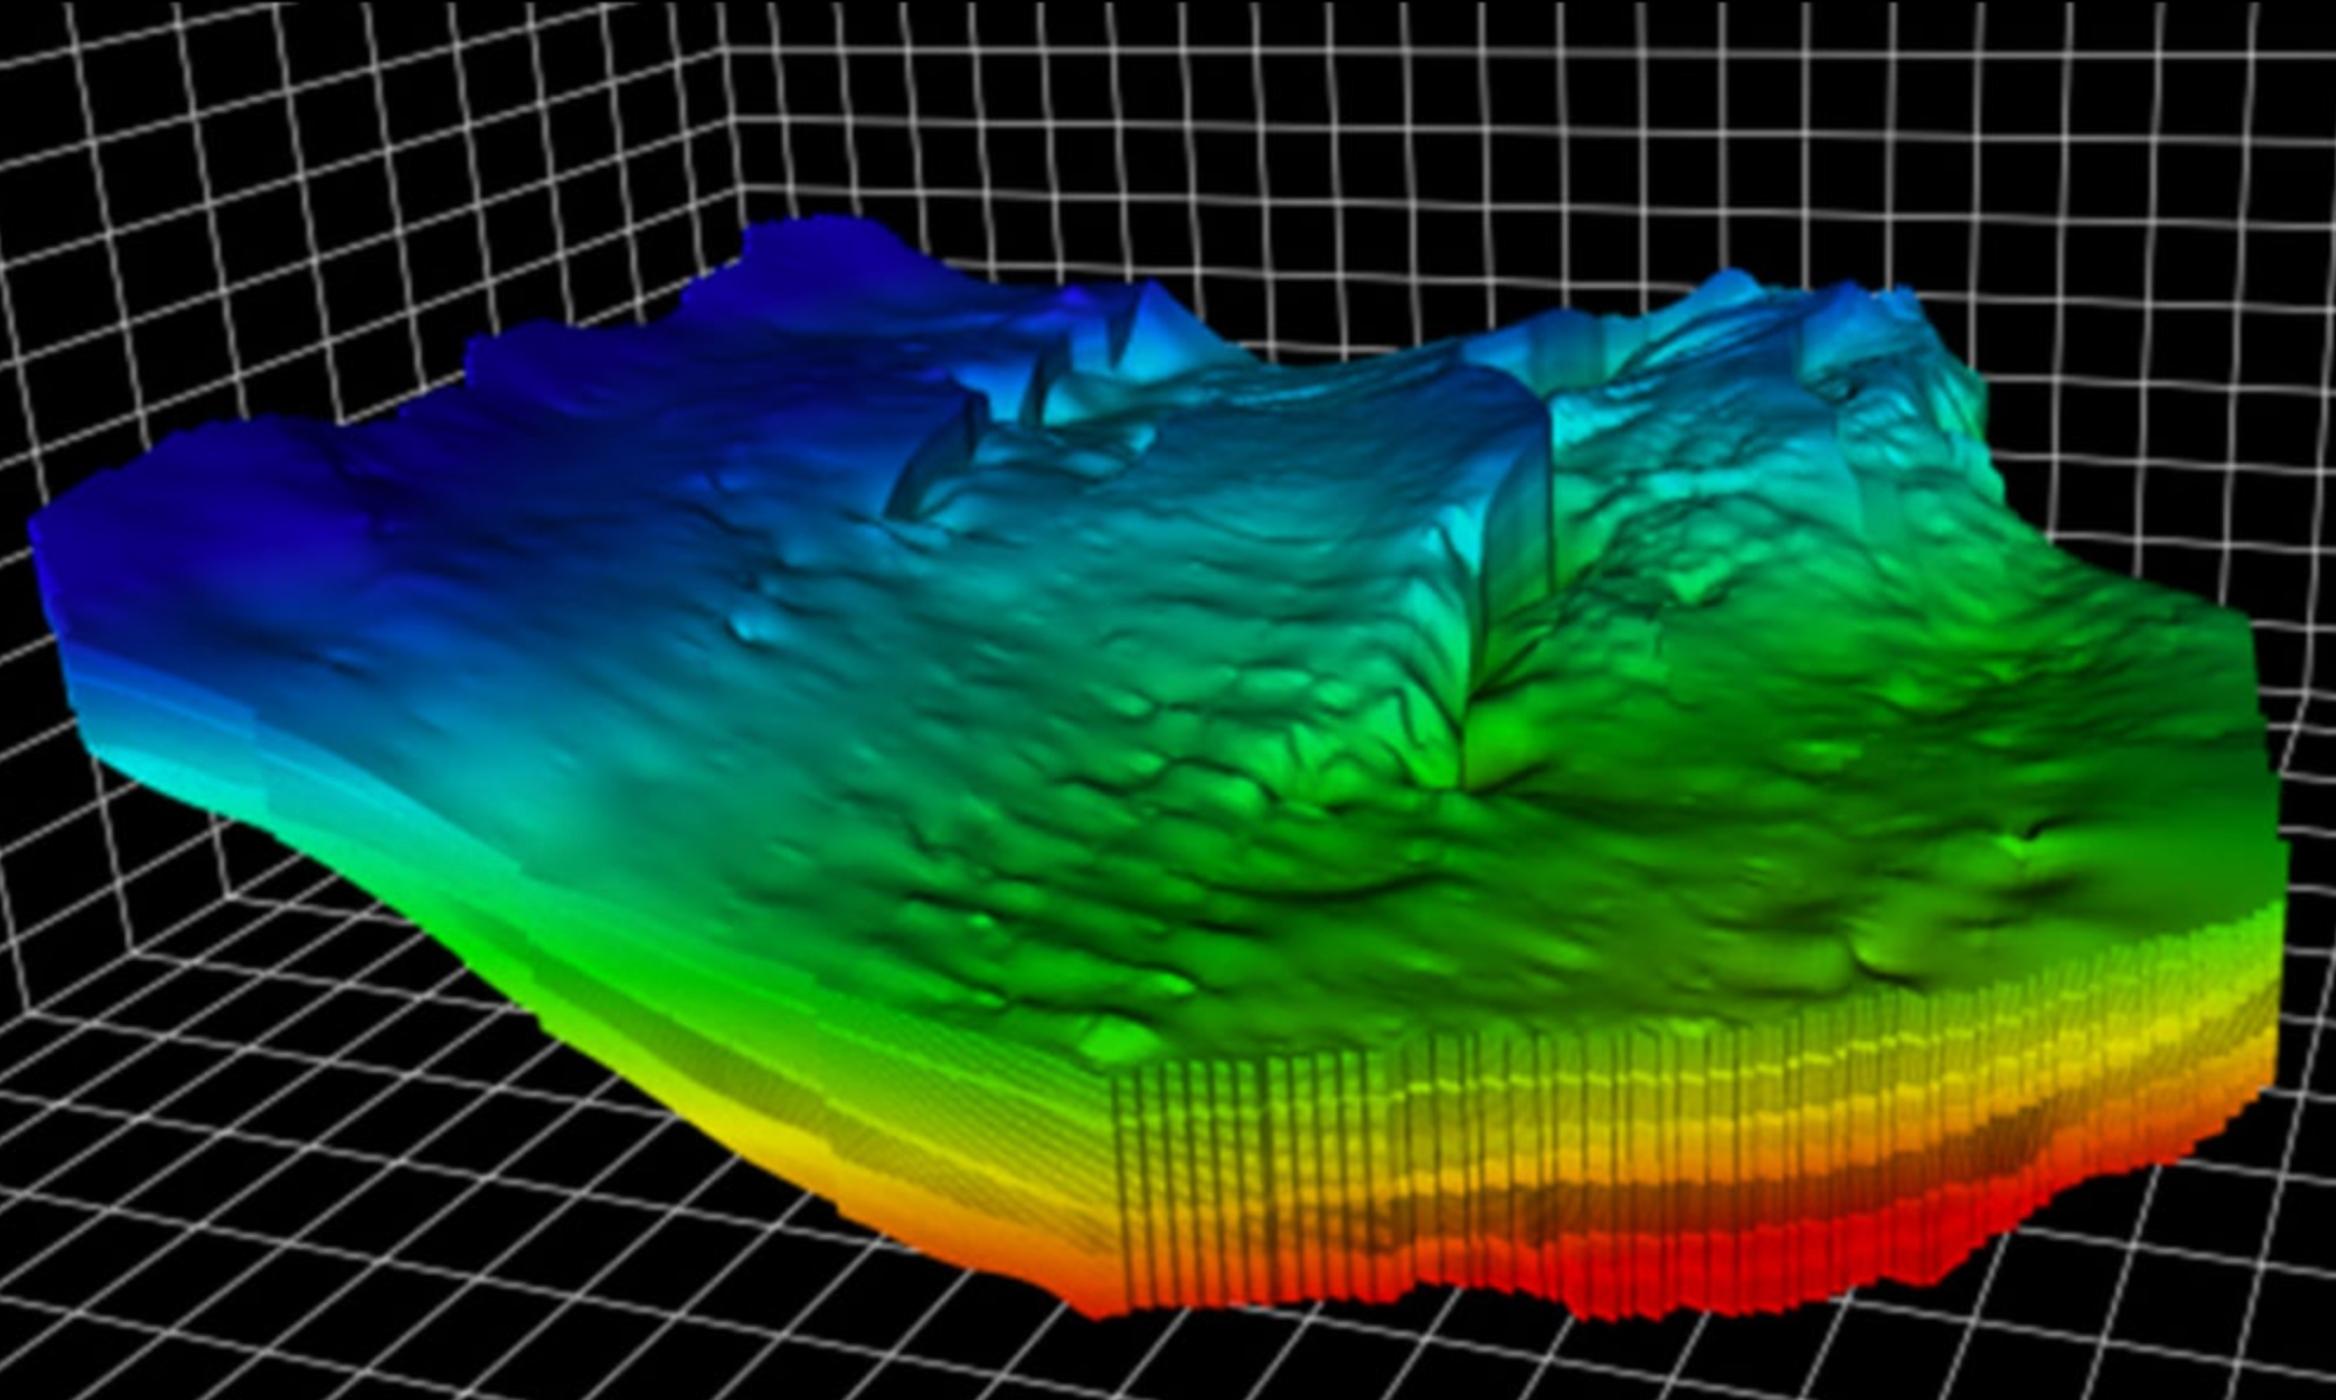
3D rendering
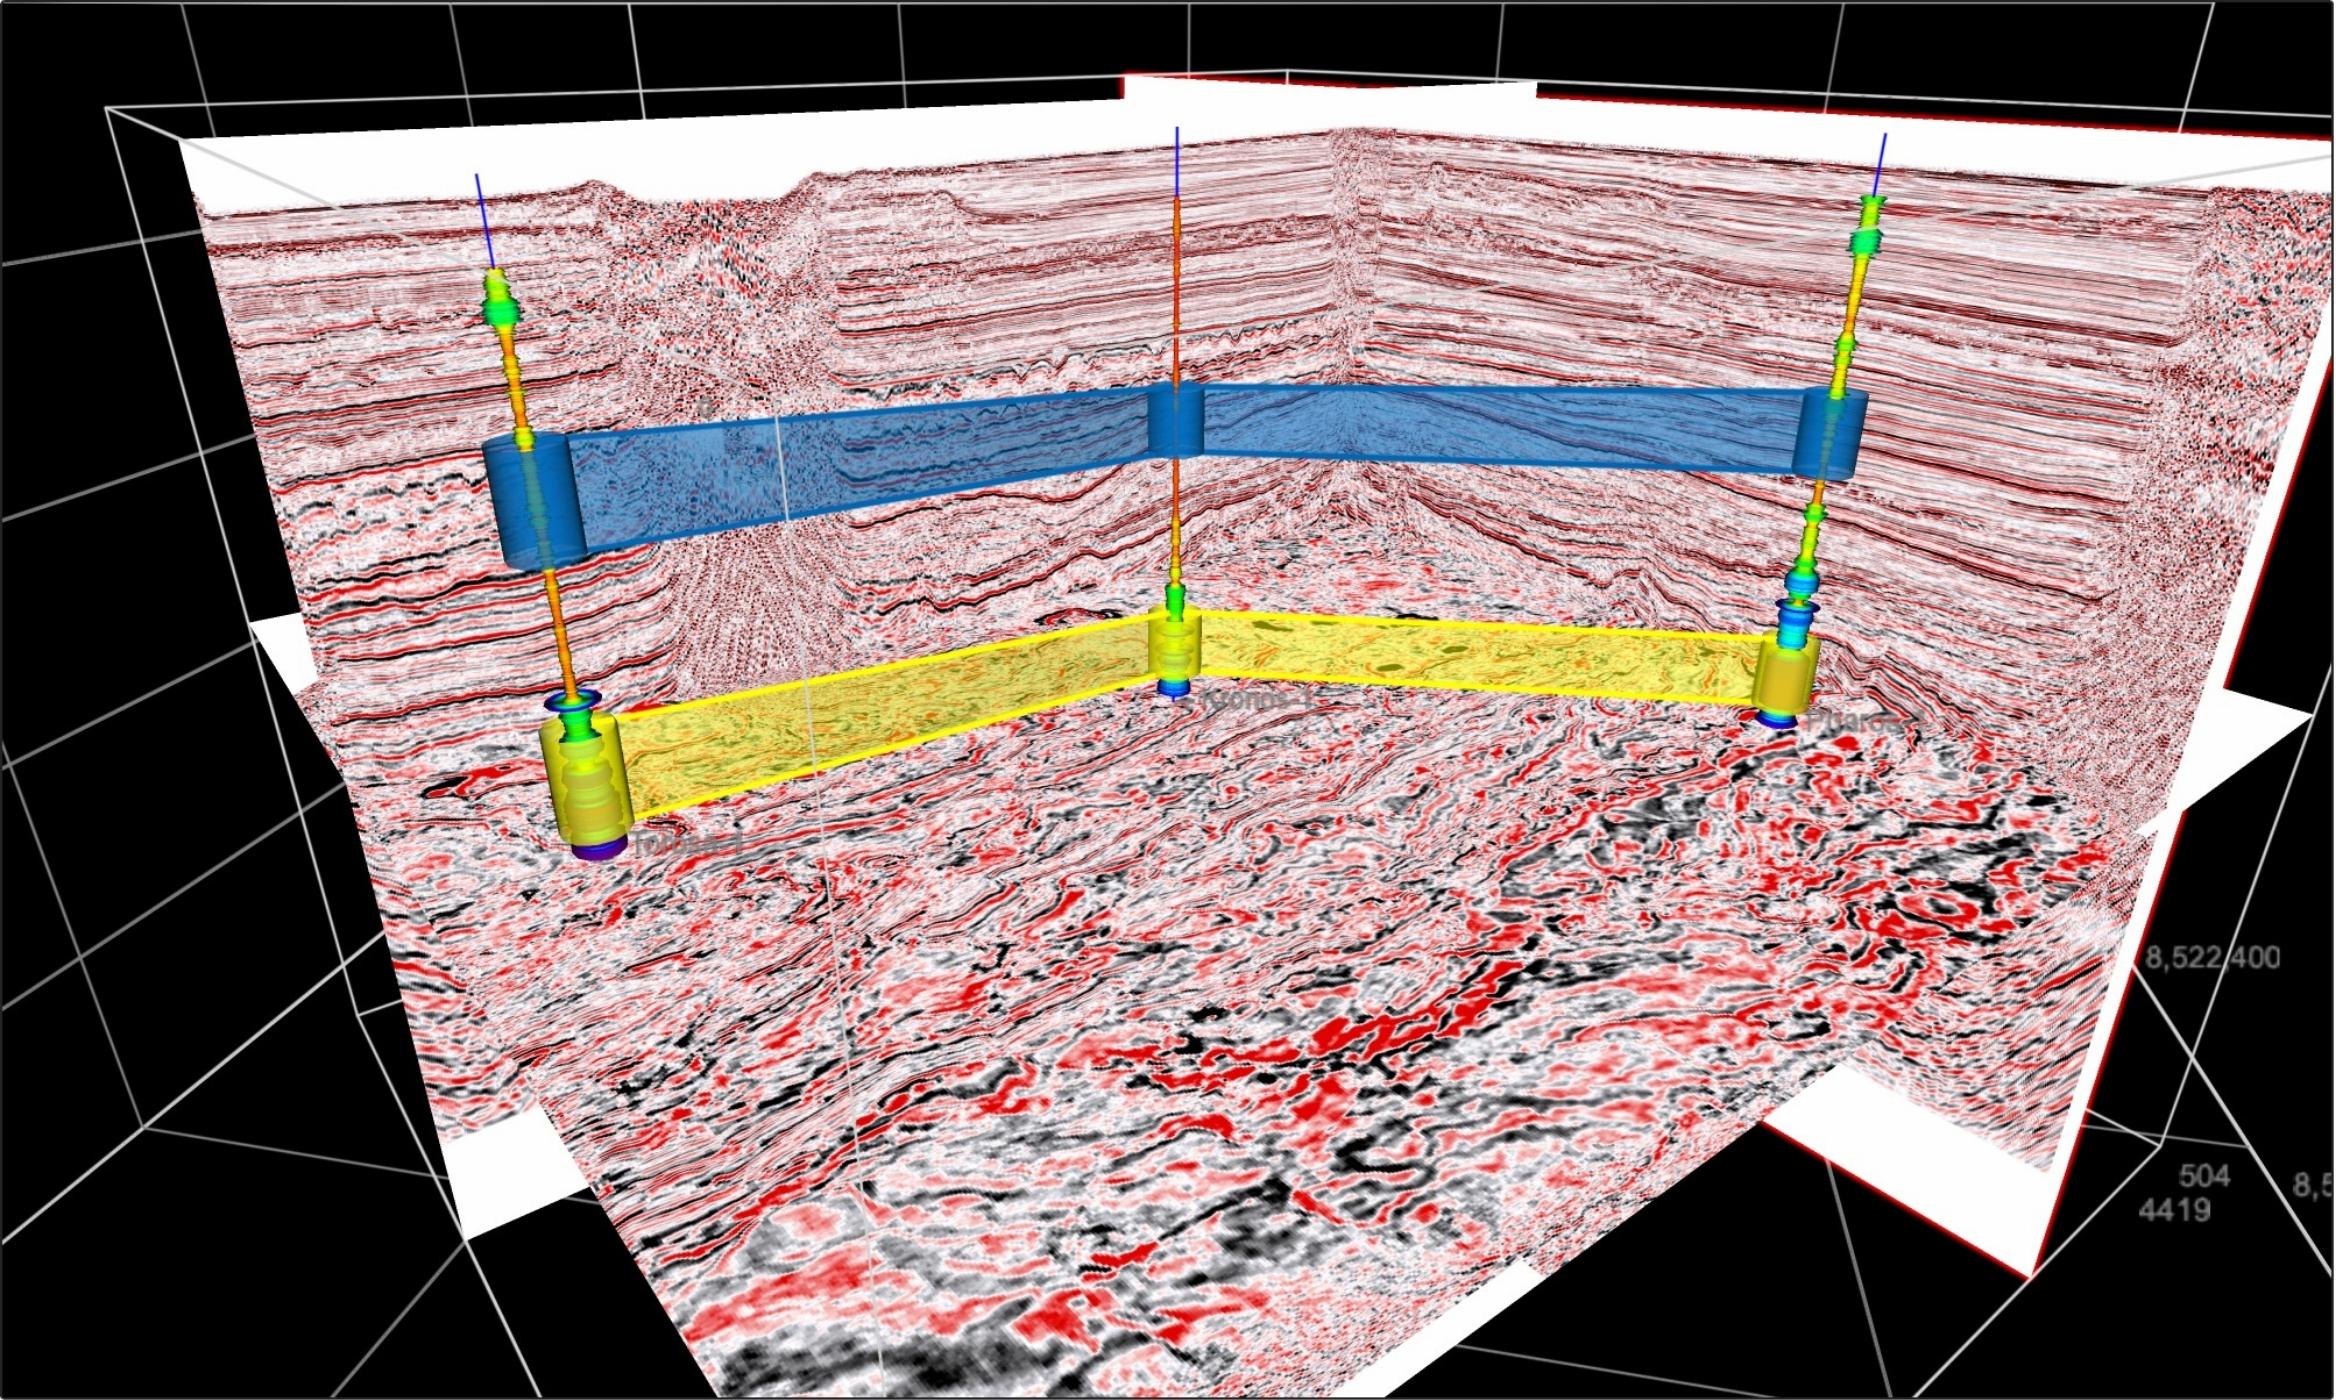
A feature-rich 3D library for developing professional applications in oil & gas, CAD, engineering, and mining. Display your seismic and reservoir data in 3D. The 3D plot uses WebGL technology to achieve GPU rendering in the browser.

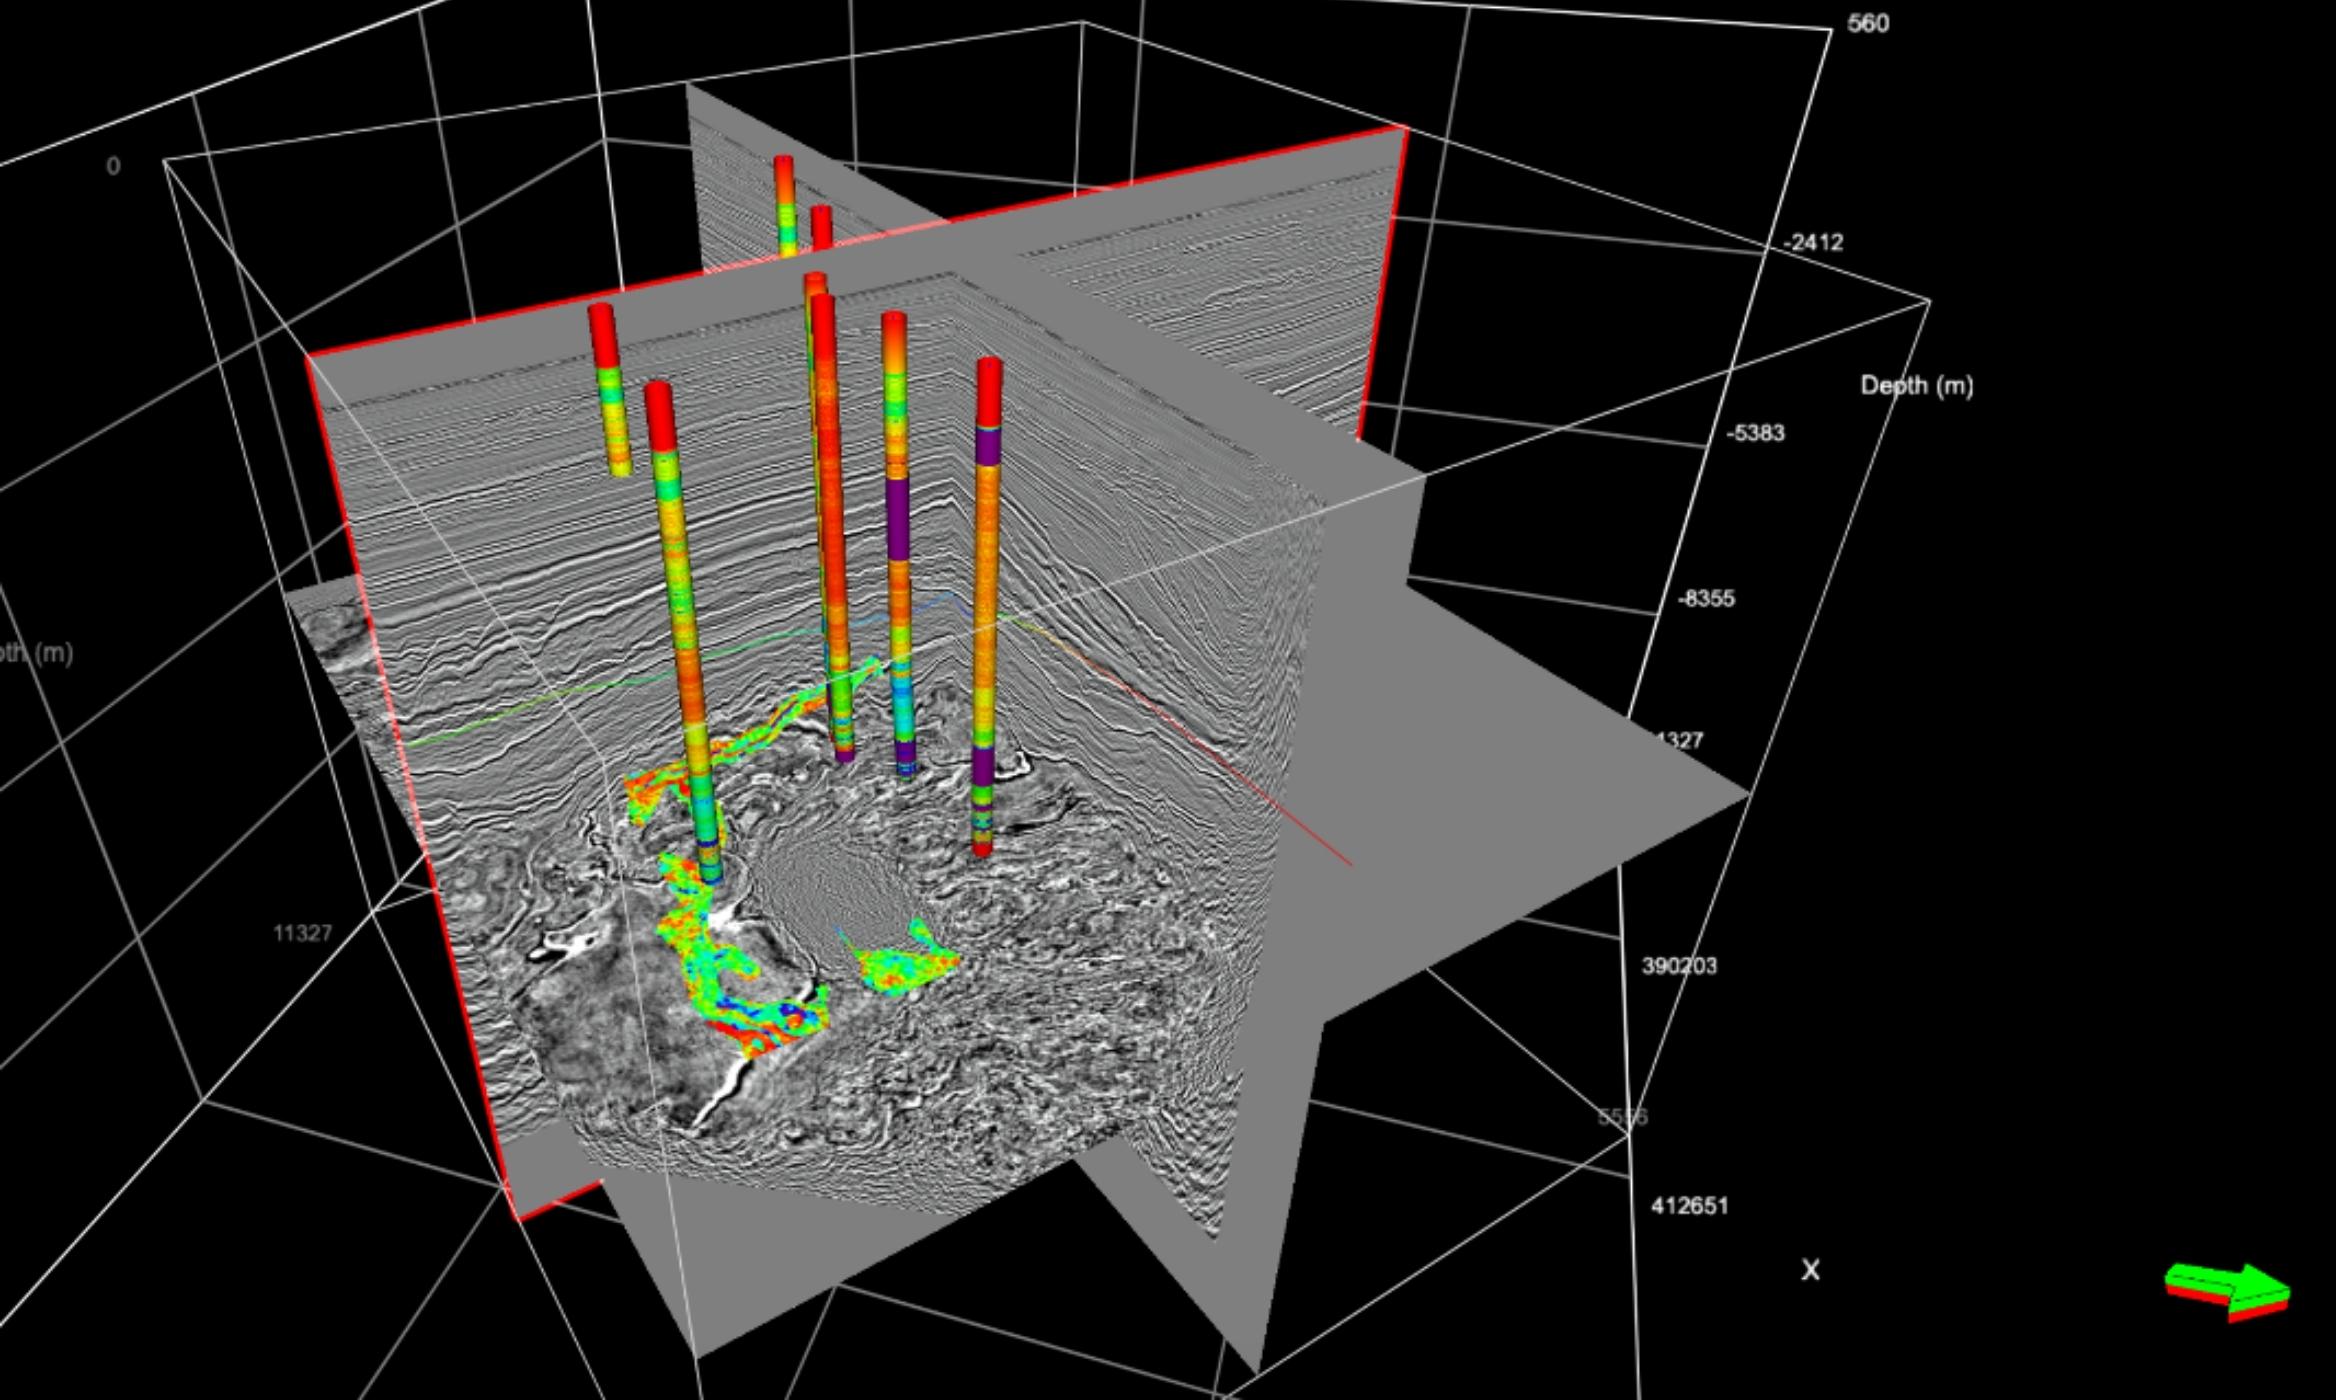
Seismic in 2D, 3D and 4D
View, interpret, edit, and process 2D,3D and 4D seismic data with integrated components to overlay annotation, picks, logs, or contours. View broadband seismic, 3D and 4D seismic, or view seismic data in real time. Supports server-side and client-side rendering.

Crossplot
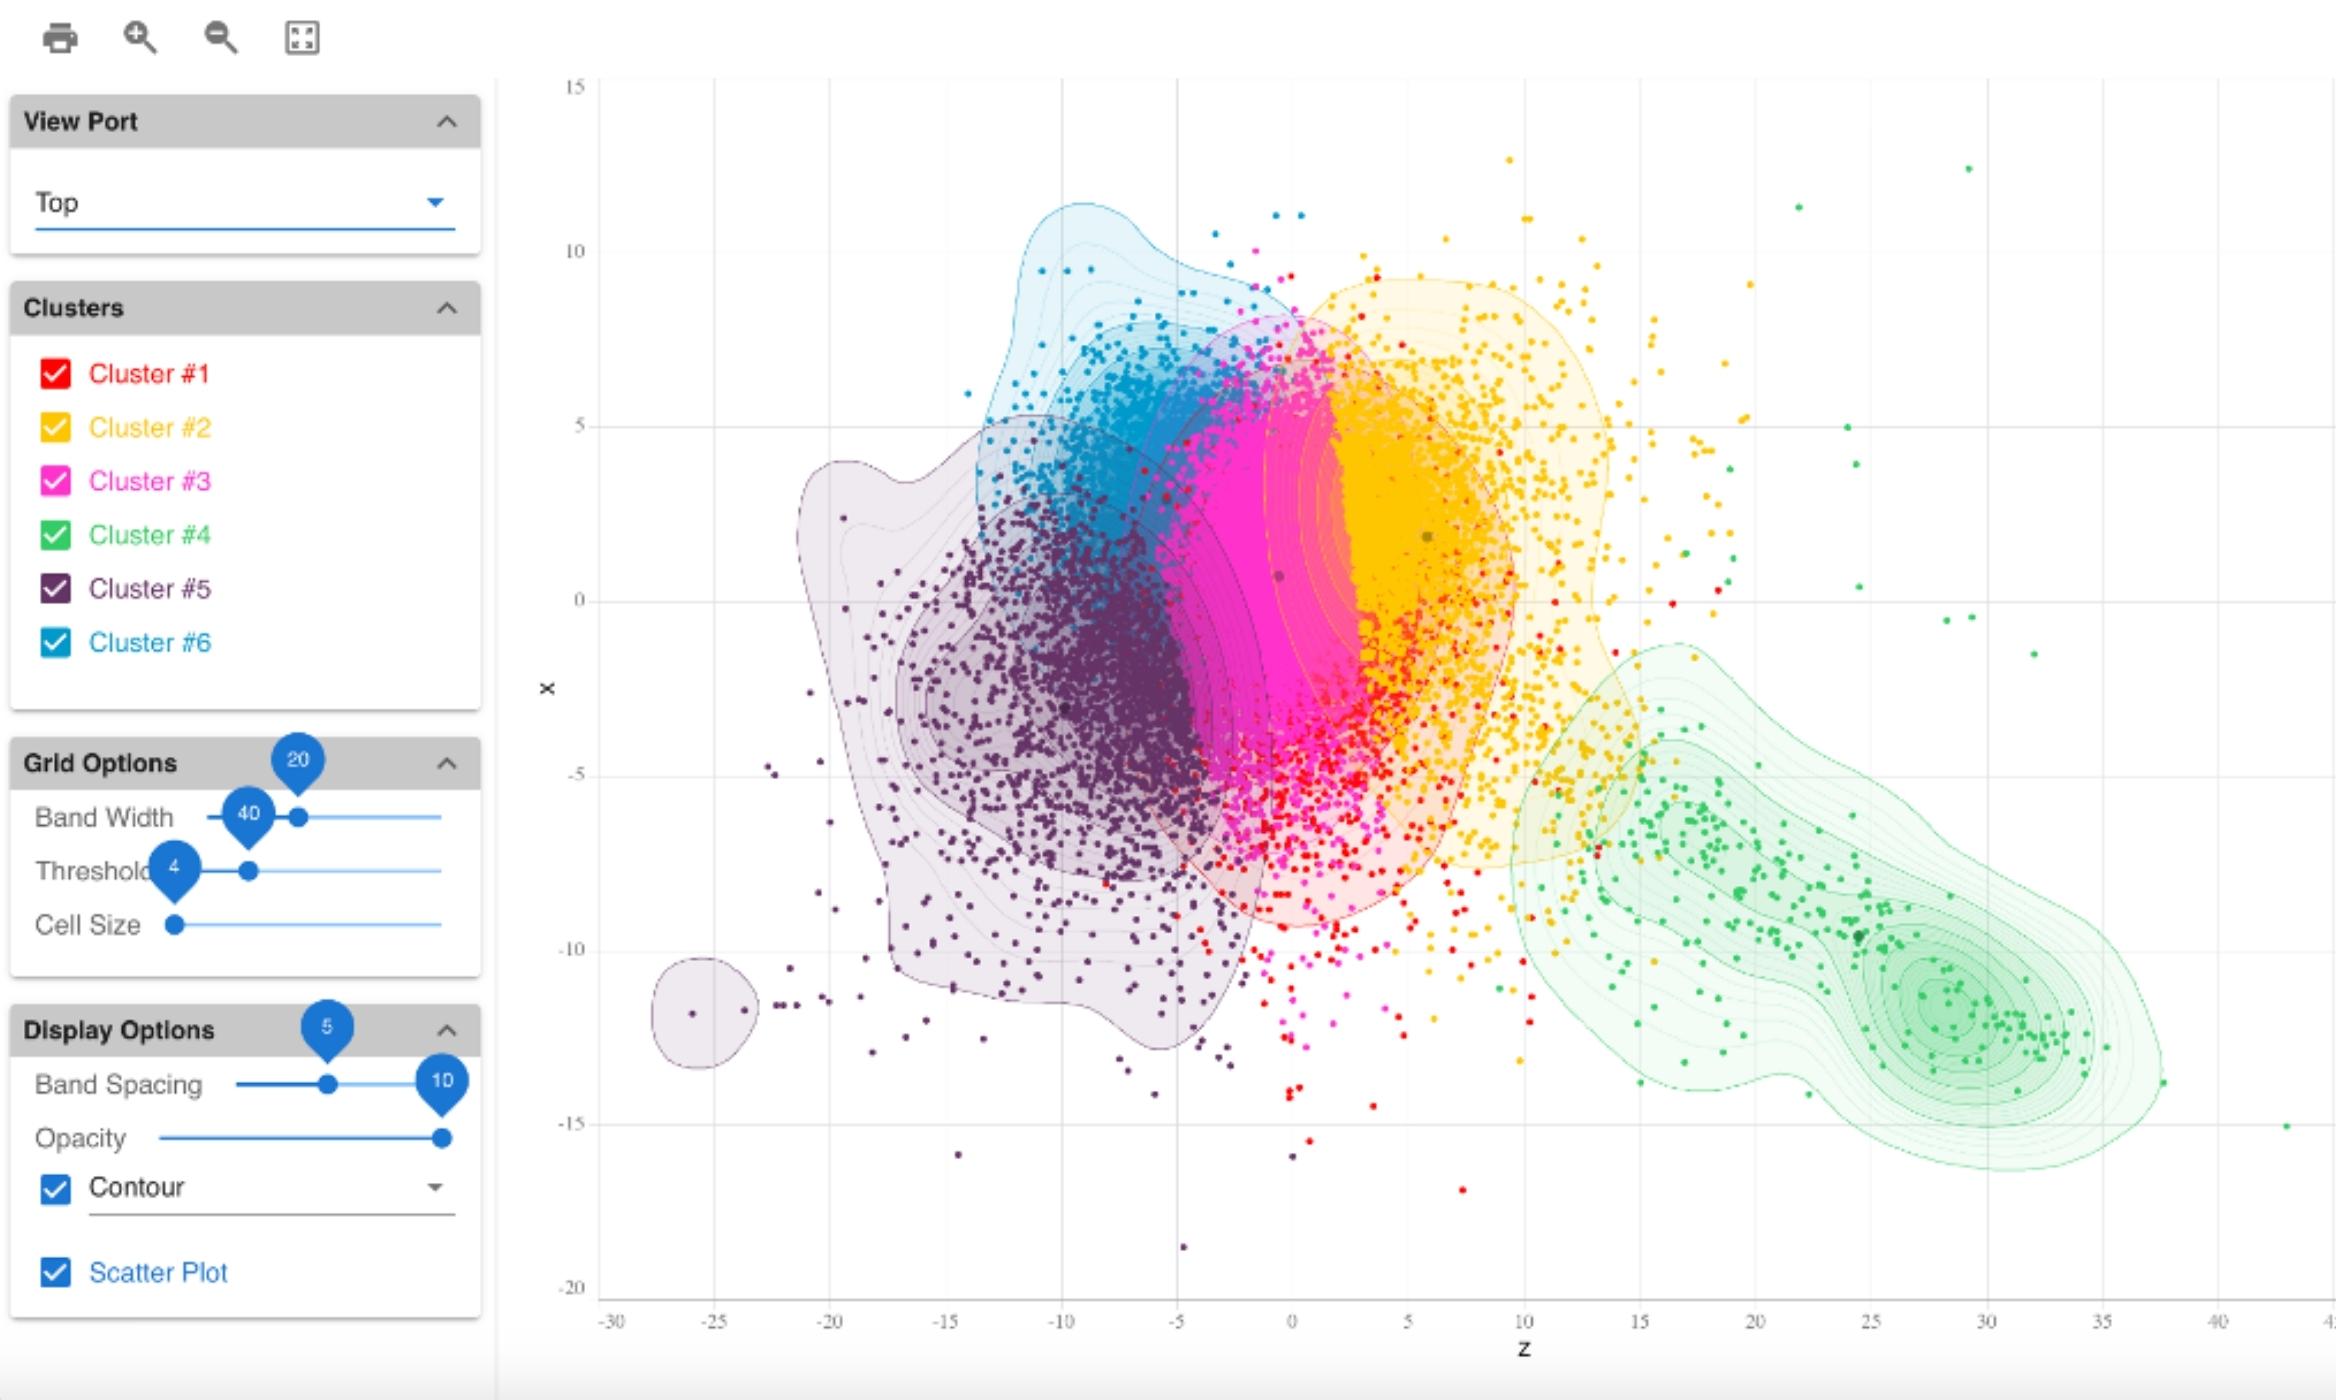
Compare measurements along two or more axes with this 2D scatter plot visualization. Customize your graph to display reservoir characterization, seismic, or to interpret geophysical, geochemical, and hydrologic data. GeoToolkit libraries offers both linear and logarithmic crossplots.

Large volume rendering
Create high-quality, high-performance visualizations of very large datasets, including billions of cells (gigagrid), using our library of 3D components. These are designed for interpretation, 3D tool design validation, reservoir rendering, analysis, and QC. They provide volumetric rendering capabilities (including external renderers like Intel OSPRay, NVIDIA IndeX).

Well logs
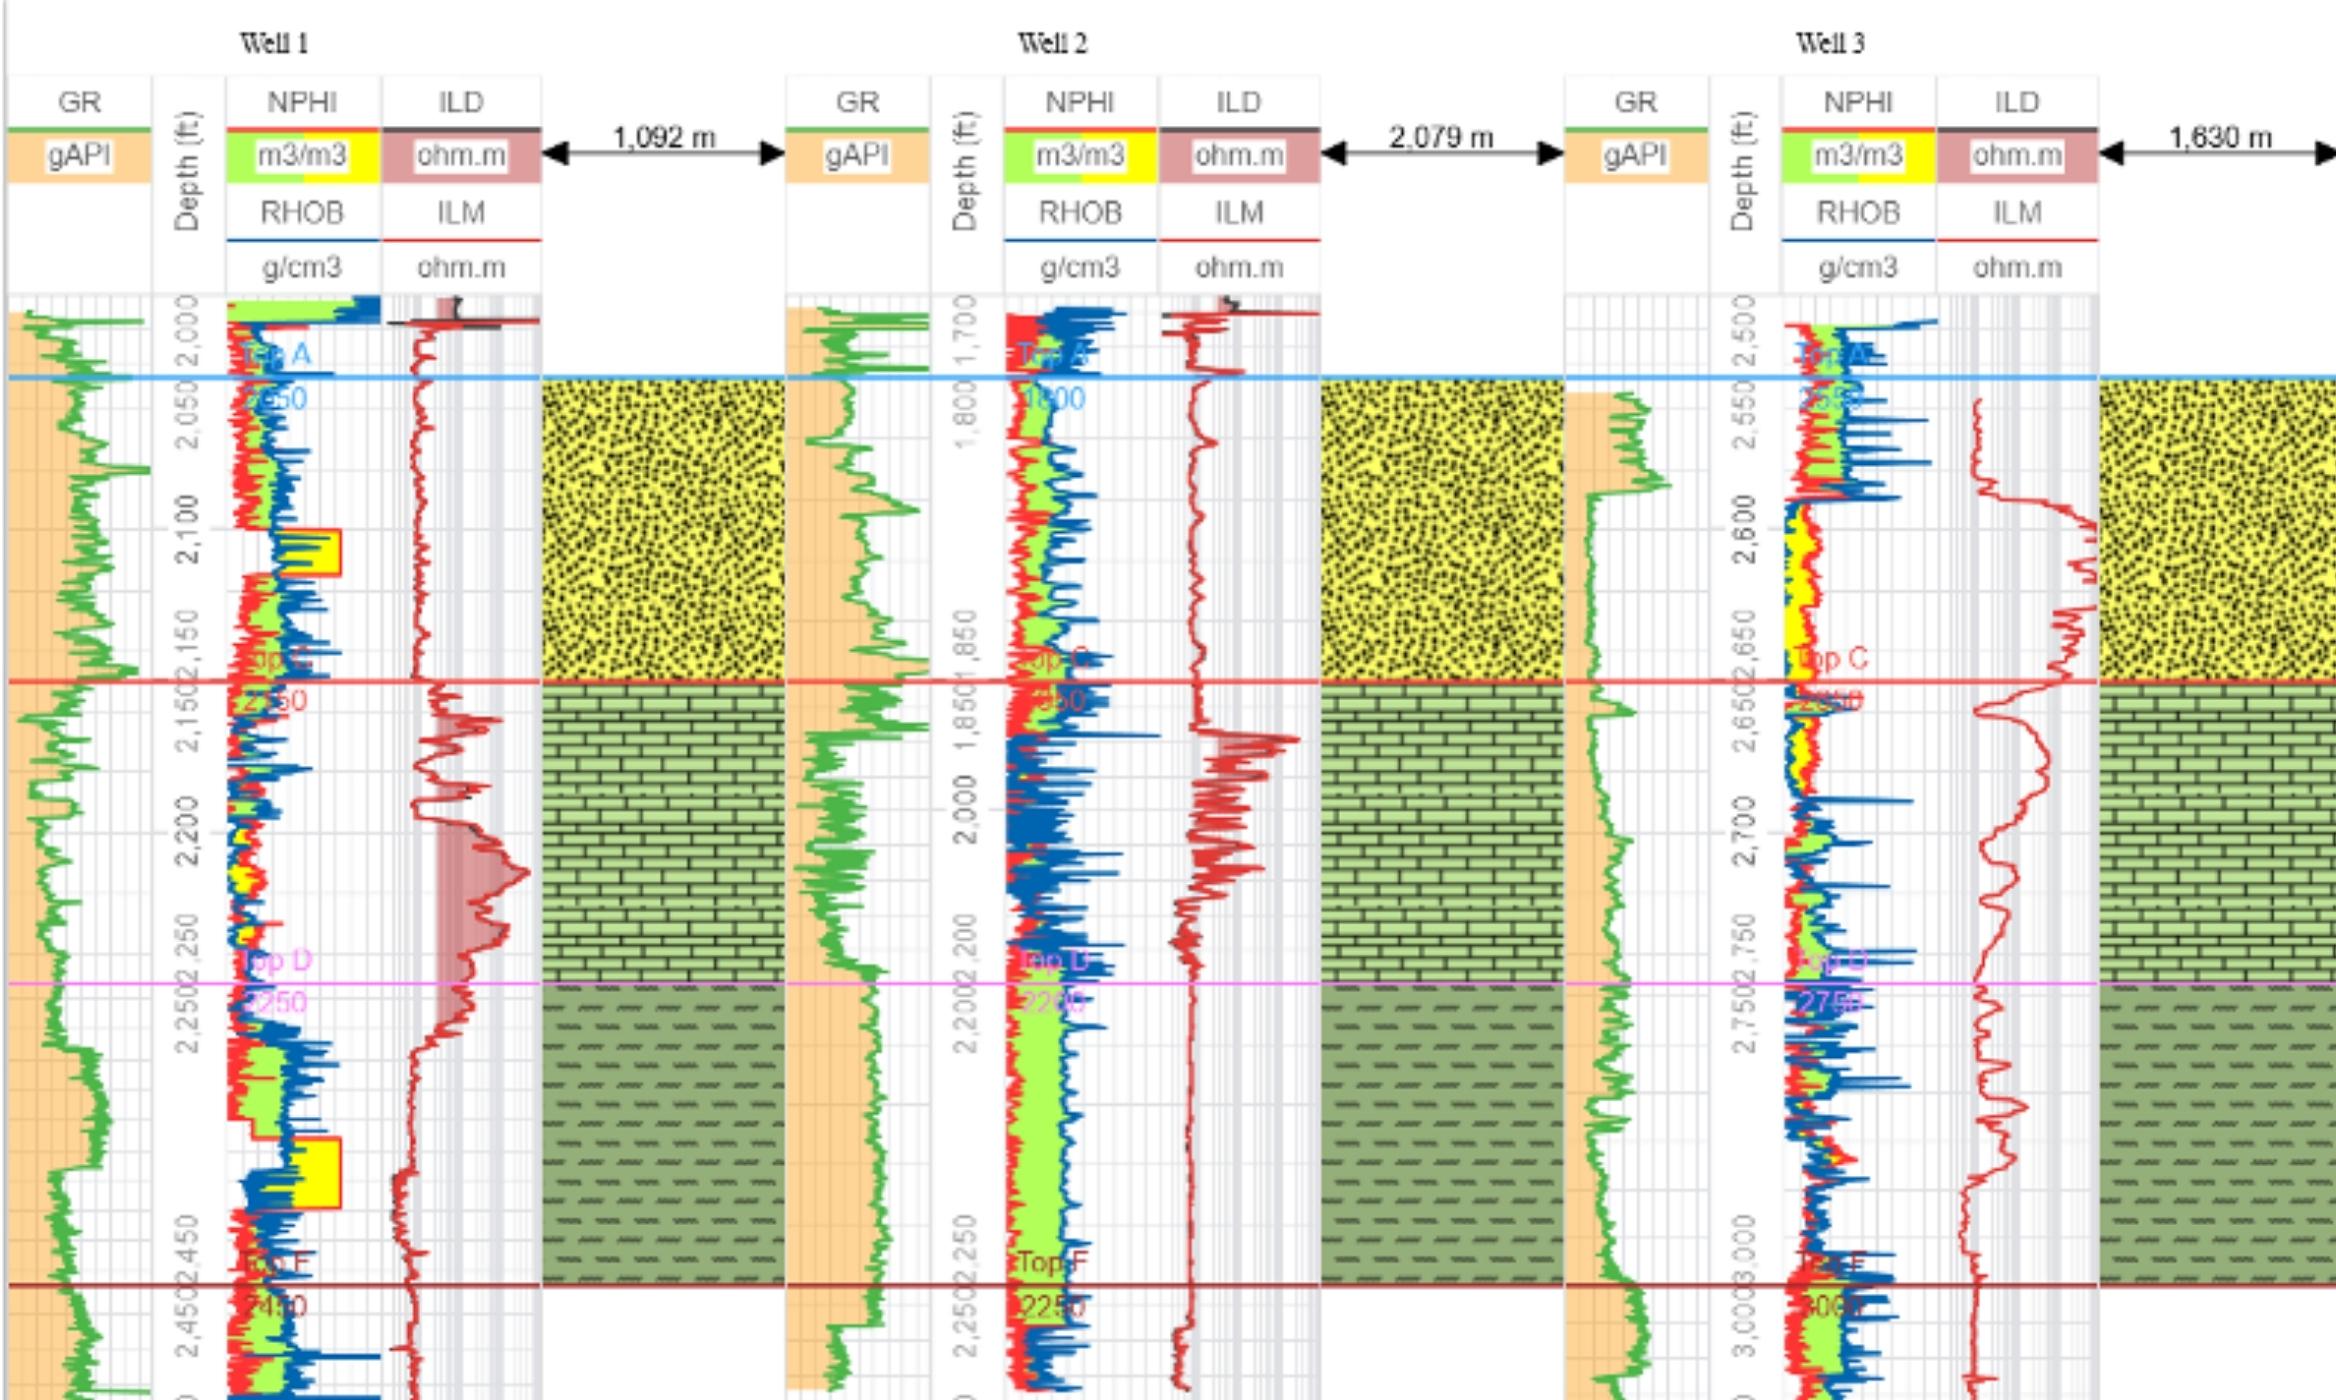
Build subsurface drilling, petrophysical analysis, or data management applications with single or multi-well displays that can correlate more than 1,000 wells in seconds. Connect to real-time data such as WITSML and display horizontal, deviated, map, and 3D well logs.

Maps
Seamlessly integrate a variety of popular WMTS services, including Google, Esri, MapQuest, ArcGIS GeoServices, OpenStreet Map, and more.

Report builder
Create PDF reports with multiple widgets, minimizing the time it takes to build custom log headers. Integrate a custom application and connect to data. Available as a ready-to-go add-on, or you can code your solution by hand.

Well schematics
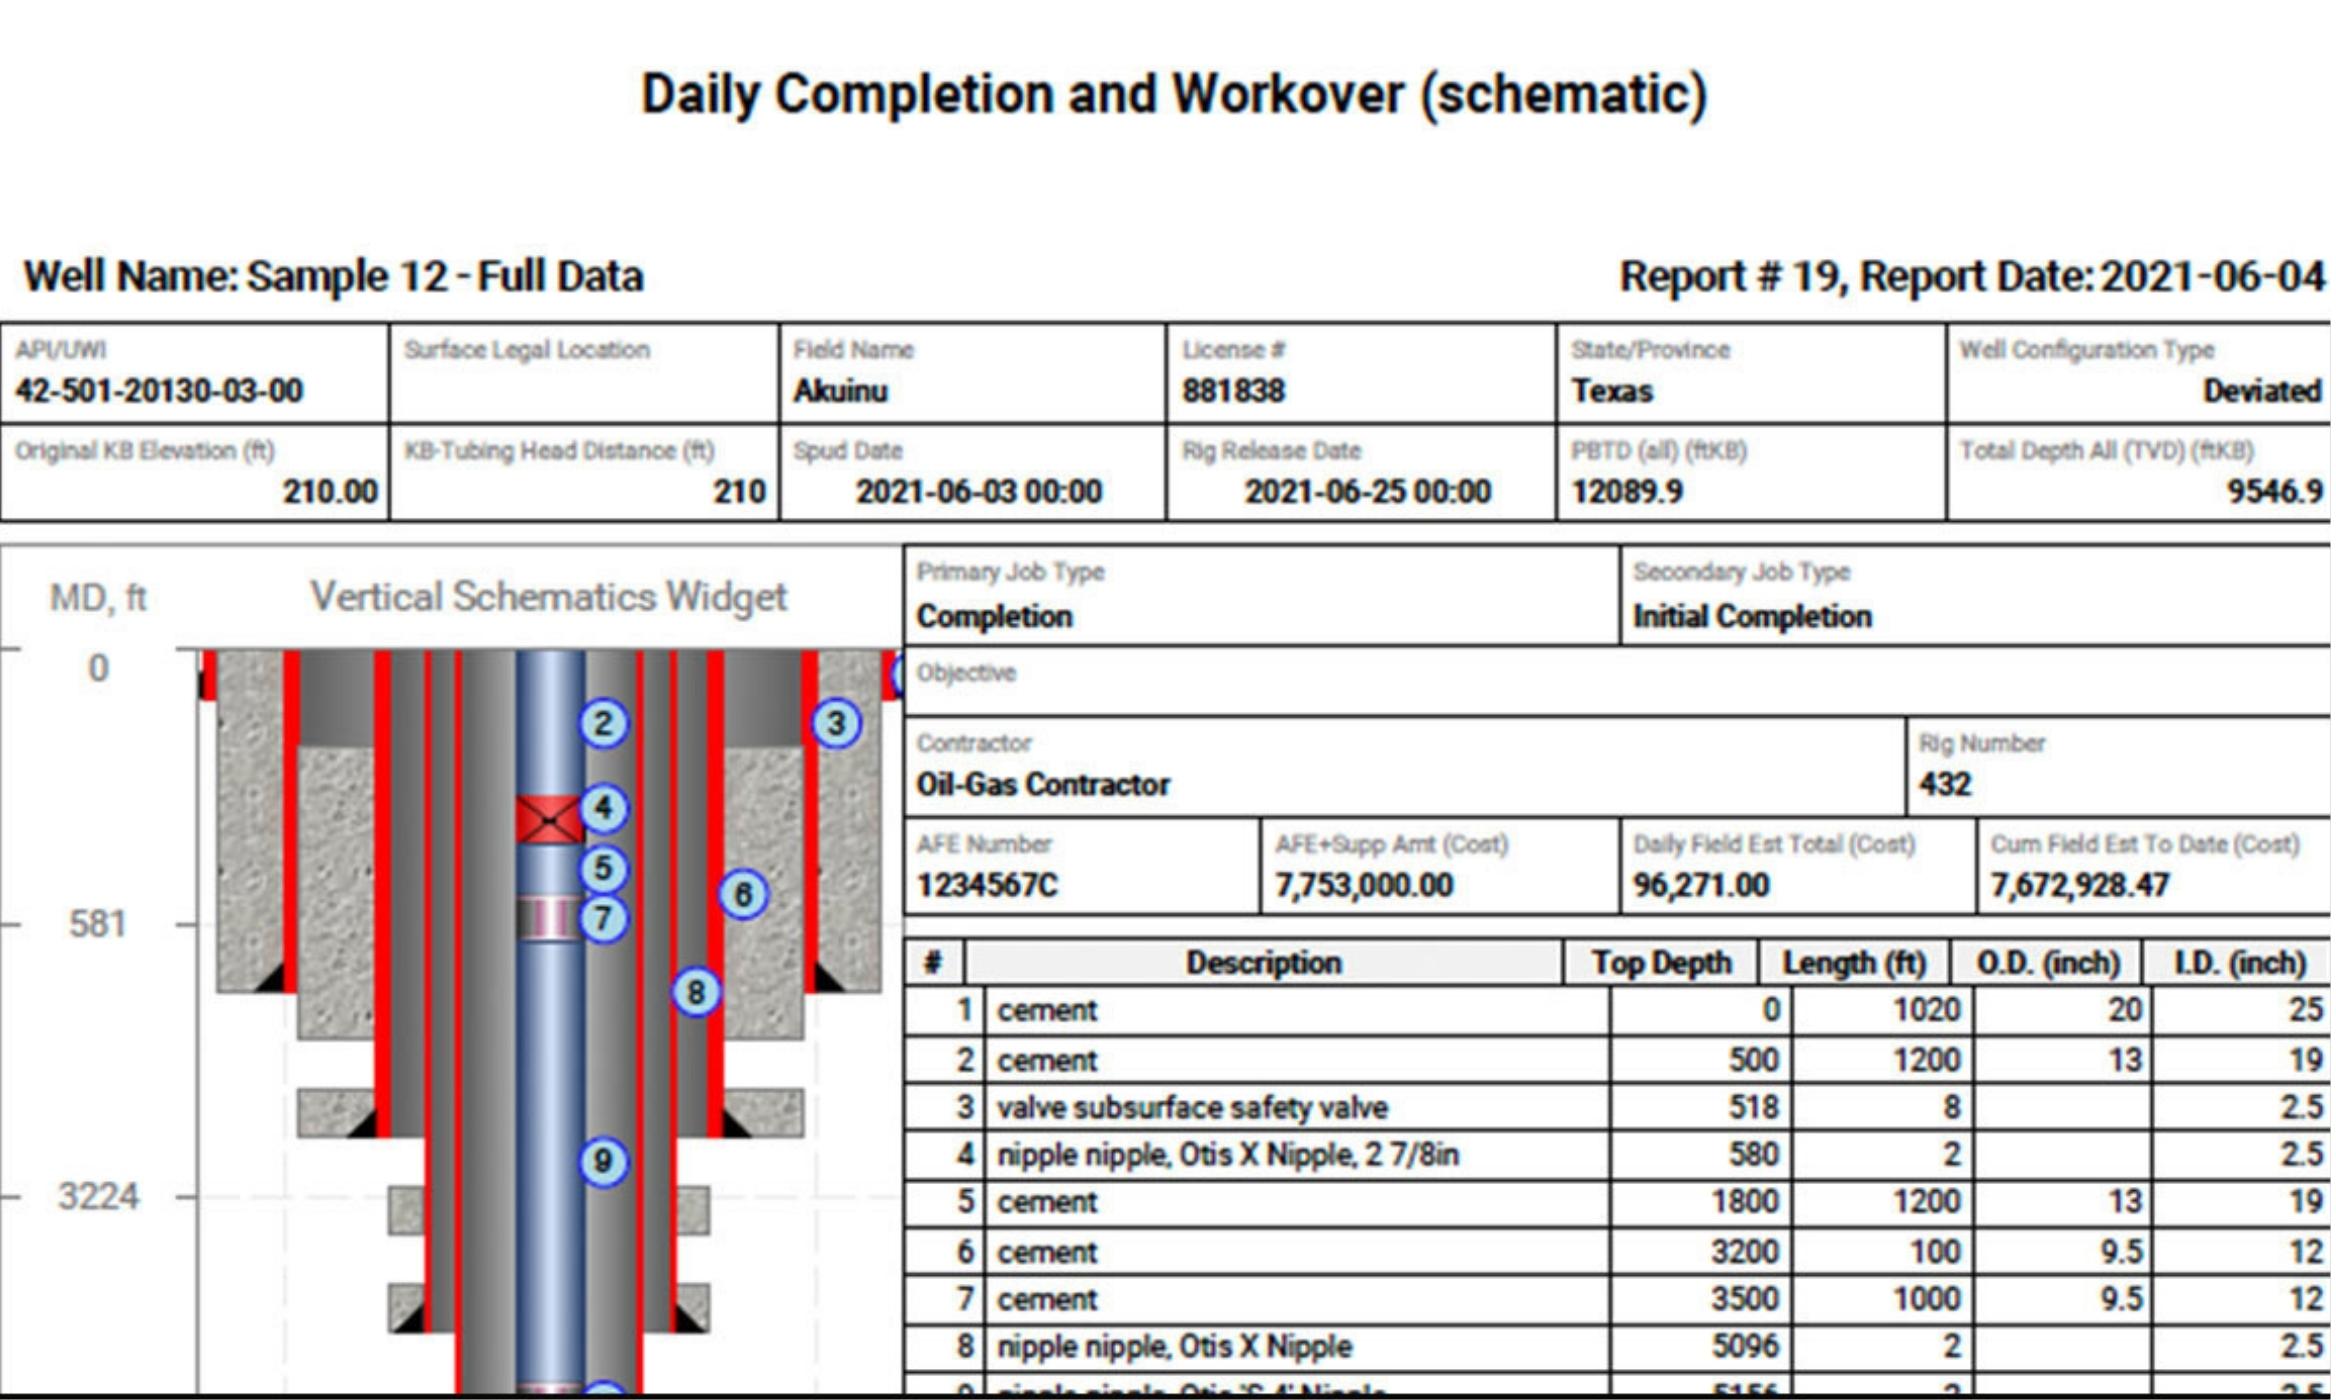
Visualize wellbore, downhole equipment, including drilling, completion, production, and workover operations. Display and edit BHAs and vertical, deviated, multilateral, and horizontal wells.

Gauges and alarms
Combine textual, radial, and linear gauge types with alarms to notify users when values reach pre-defined thresholds in real-time monitoring applications.

Contours
Display a gridded or triangulated surface as a contour. Customize the frequency and appearance of contours, annotations, and colors.

Charts and maps
Create stunning charts, graphs, and maps with minimal programming effort with our extensive set of samples and tutorials. Extend existing charts or create new ones through a powerful API.

Time series
Visualize multiple time series data with annotations and overlays for easy correlation and analysis in normal, stacked, or percentage mode.

Why GeoToolkit libraries?
The libraries behind energy visualization.
Enhance your energy applications with our flexible data visualization libraries or build powerful, custom solutions from scratch.
Get the support you need with online documentation and our dedicated technical support team.
Supports for most subsurface data types, including LAS, DLIS, WITSML, SEG-Y, SEG-D, and more.
Designed for developers
GeoToolkit libraries power key SLB technologies such as Petrel subsurface software, the Delfi digital platform, and IVAAP energy data visualization and BI solution—and can also be integrated into third-party or custom solutions for broader flexibility.
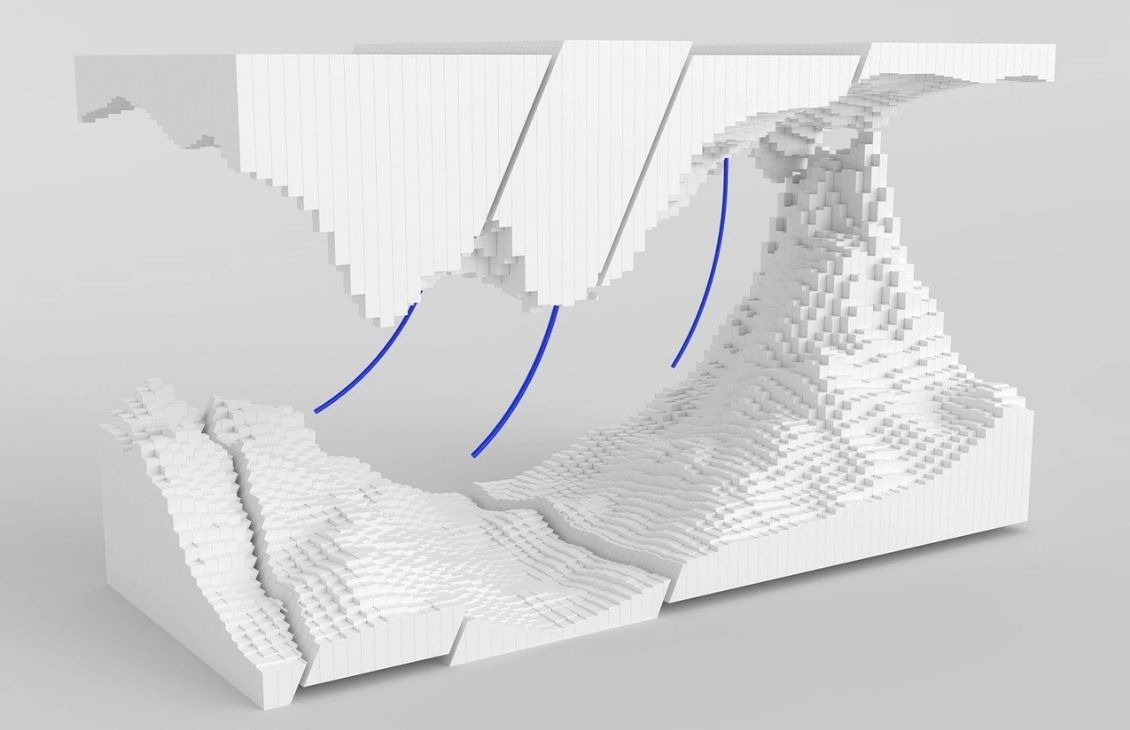
Petrel subsurface software
Enable discipline experts to work together and make the best possible decisions from exploration to production.
Delfi digital platform
Open, scalable, and secure, cloud-based software environment with 24/7 operational support.
IVAAP energy data visualization and BI solution
Unlocking subsurface insights through unified data visualization and workflow integration.

New developer documentation
Whether you’re building interactive well logs, seismic displays, or custom geospatial solutions, our documentation provides the resources you need to succeed.
Explore