Living Digital
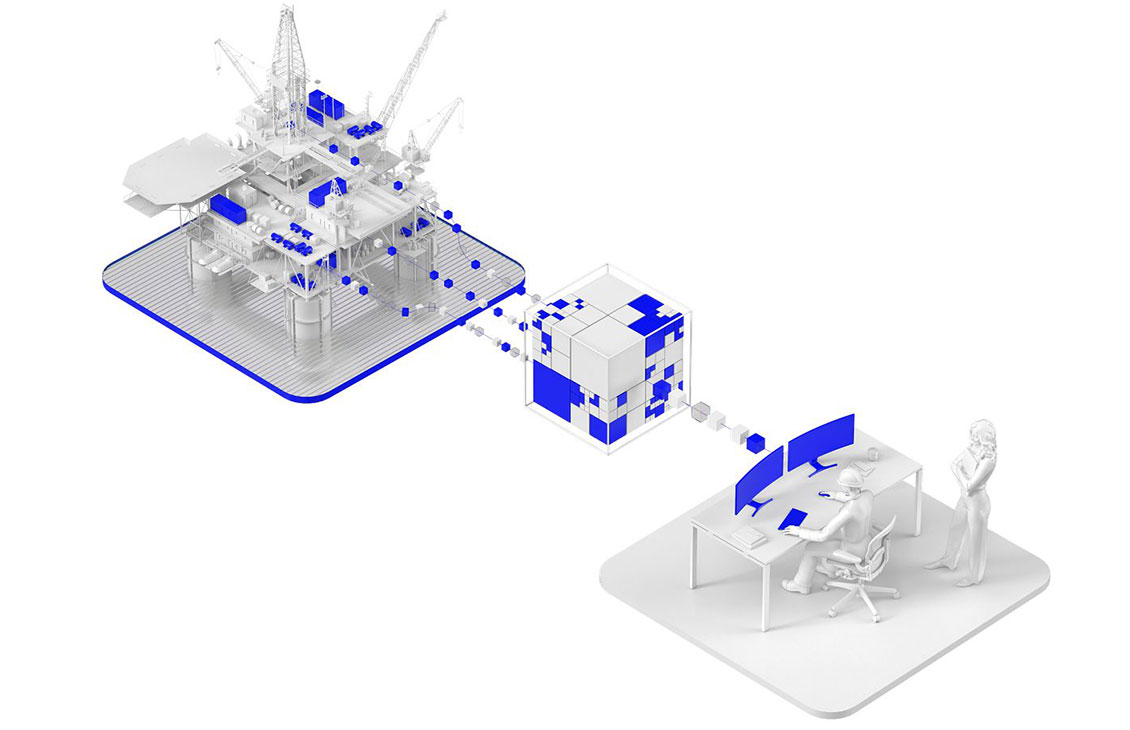
Transforming the energy industry performance and driving decision making at speed

Articles
Latest digital articles


Upcoming webinars
New webinars will be posted as they are scheduled.
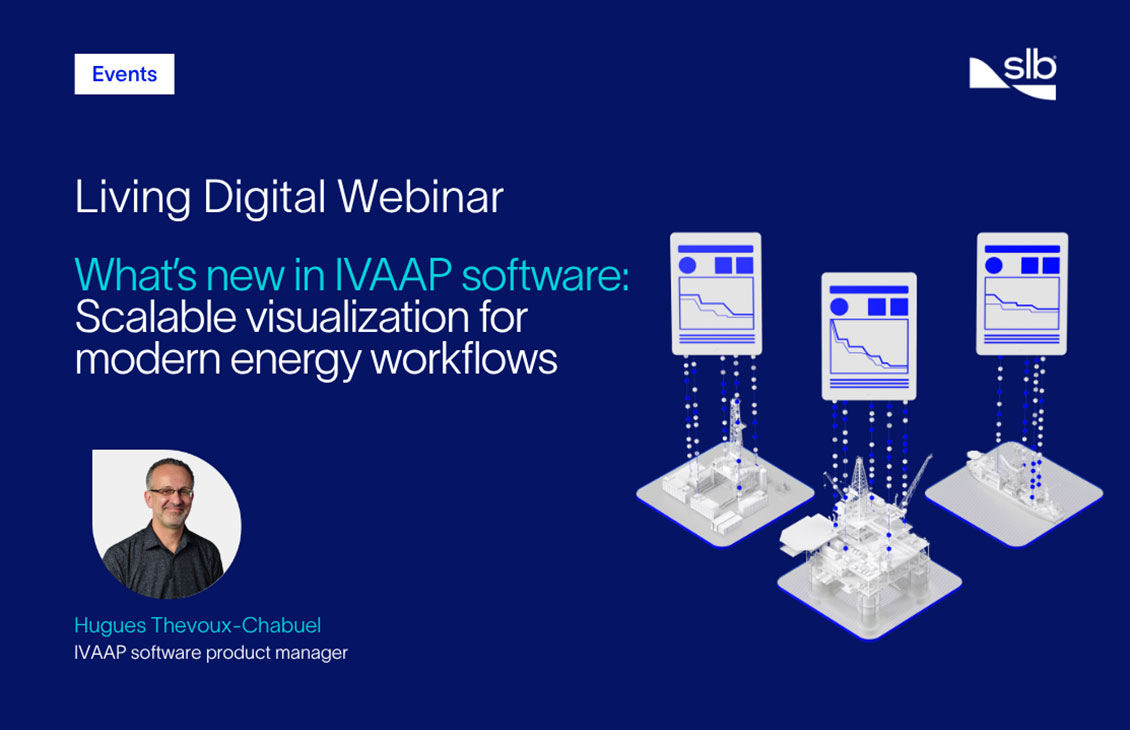
Webinars
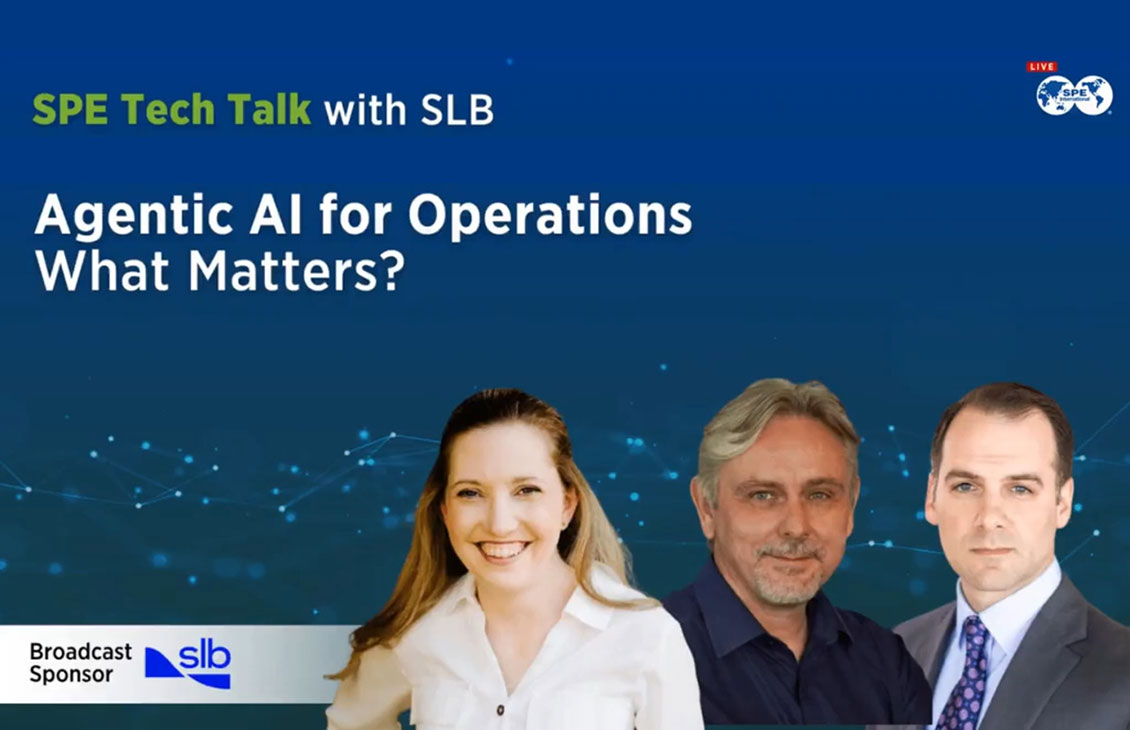
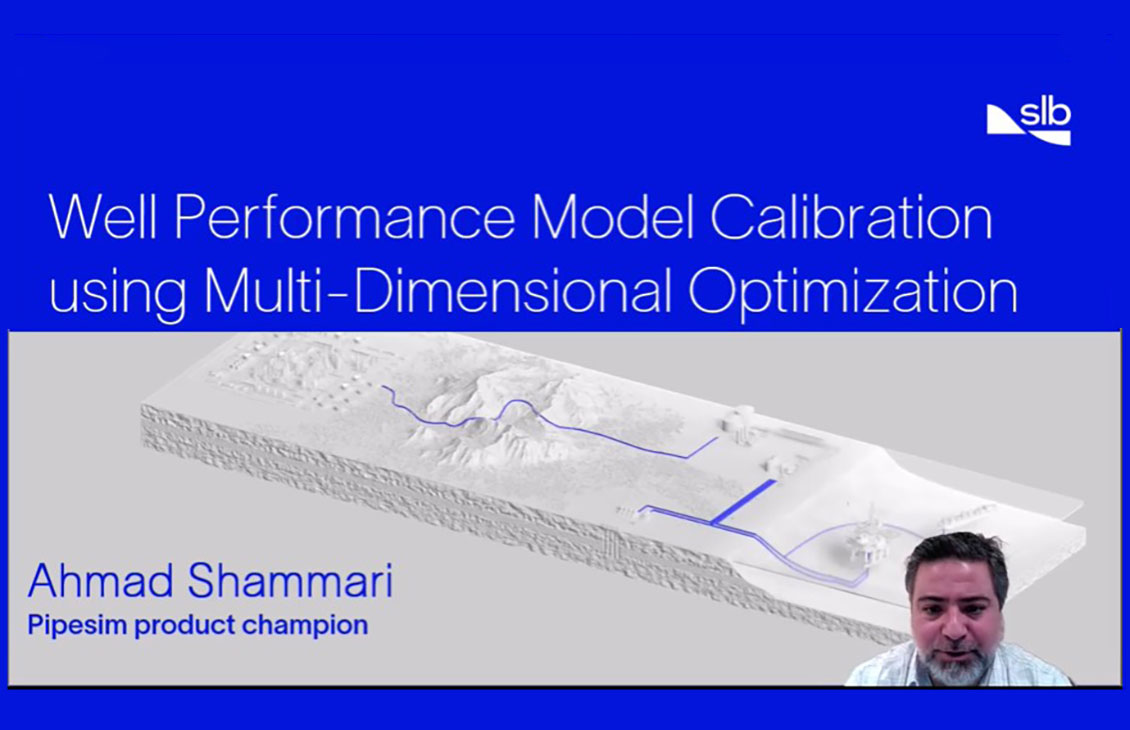
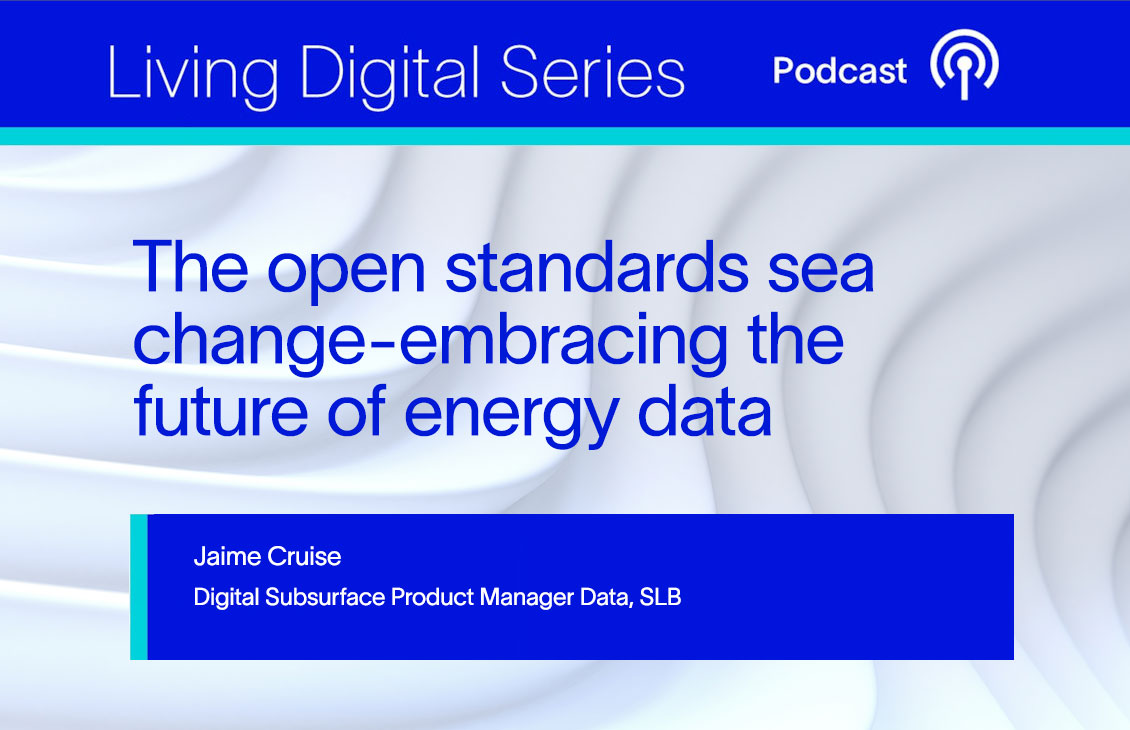
Latest on-demand webinars
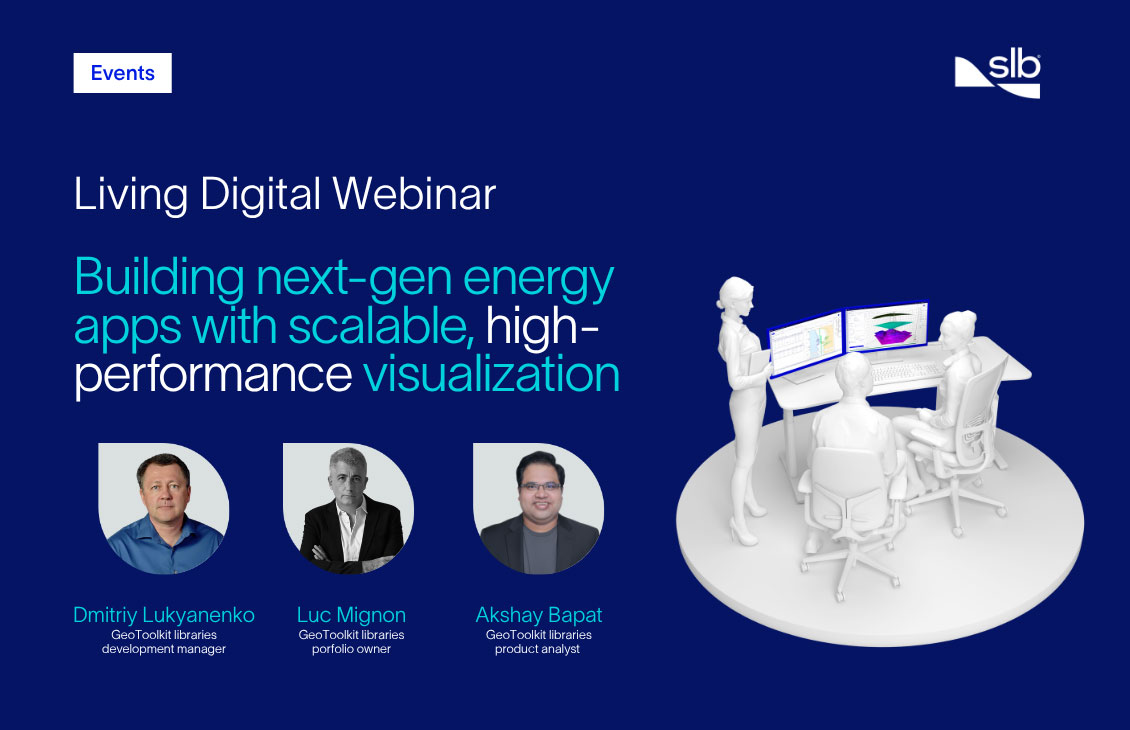
The Living Digital webinar series tells the ongoing story of how we’re developing and deploying AI, machine learning, data management, and other digital solutions in combination with deep domain expertise to accelerate our customers’ digital transformation.
Blogs