The Defining Series: Measuring Porosity Downhole
Published: 09/09/2015

The Defining Series: Measuring Porosity Downhole
Published: 09/09/2015
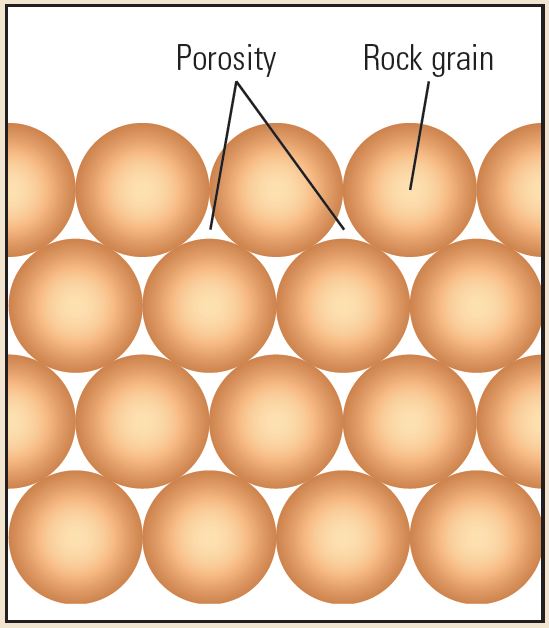
When it comes to evaluating conventional reservoirs, petrophysicists are Porosity Rock grain often concerned with three key parameters: permeability, porosity and the presence of hydrocarbons. Permeability is the measure of a rock's ability to allow fluids to pass through it. Porosity is the volumetric void space in the rock to log analysts the space not occupied by solid material (Figure 1). Without the presence of hydrocarbons, porosity—which is directly related to production potential—and permeability may be of little interest to log analysts.
Figure 1. Porosity. The void space in rocks not occupied by solid material may be filled with water, oil or gas.
Although porosity is a crucial parameter for evaluating reservoirs, the first logs measured formation resistivity. Introduced in the 1920s, resistivity tools helped identify potential hydrocarbon-bearing rocks. High resistivity is a characteristic of the presence of hydrocarbons and low resistivity is indicative of water. However, log analysts could not differentiate between rocks containing hydrocarbons and those with no porosity because both exhibit high resistivity. Even when hydrocarbon-bearing zones were identified using resistivity tools, the volume of hydrocarbon could not be determined without a porosity measurement.
The first porosity measurements, which became available in the early 1950s, came from sonic, or acoustic, logging tools. Sonic porosity is computed by comparing the speed of sound through the formation to that of rocks with no porosity. Sound travels more slowly though fluid-filled rocks than through rocks with no porosity.
Scientists have developed an assortment of porosity logging tools based on various physical principles. Today, although sonic porosity logs are still used, the two predominant porosity measurements are density porosity and neutron porosity.
Porosity Measurements
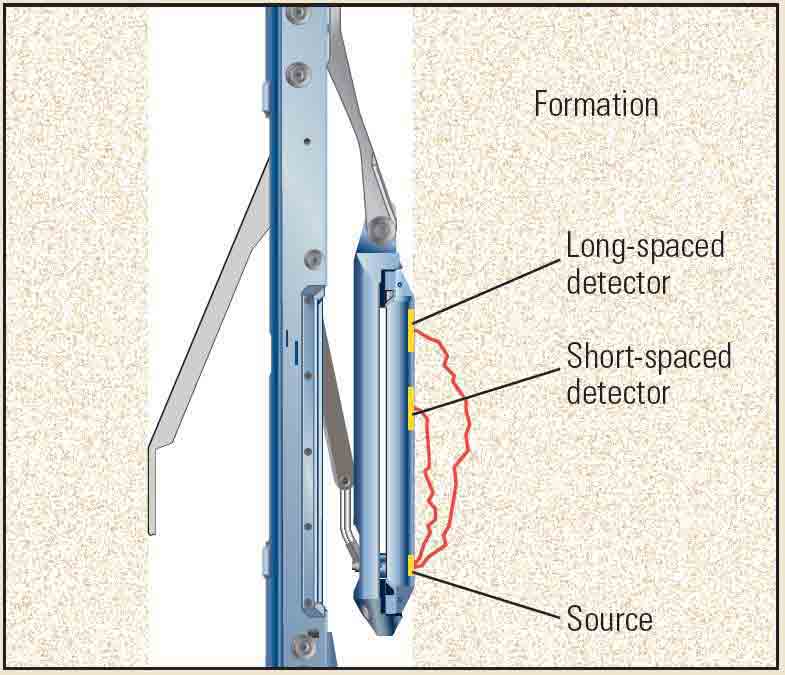
Density tools emit medium-energy gamma rays into a borehole wall (Figure 2). The gamma rays collide with electrons in the formation, lose energy and scatter after successive collisions. The number of collisions is related to the number of electrons per unit volume—the electron density. The electron density for most minerals and fluids encountered in oil and gas wells is directly proportional to their bulk density, Pbulk.
The bulk density measured by the tool, Plog, results from the combined effects of the fluid (porosity) and the rock (matrix) and is used to compute density porosity.
Figure 2. Density porosity tool. A radioactive source emits gamma rays into the formation, where they interact with minerals and fluids; some gamma rays return to detectors where they are counted and their energy levels measured.
The most common reservoir rocks are sandstone (Pmatrix = 2.65 g/cm3), limestone (Pmatrix = 2.71 g/cm3) and dolomite (Pmatrix = 2.87 g/c3). These matrix density values are used to compute density porosity. The other input, Pfluid, is usually that of water (1 g/cm3).
Appropriate choice of Pmatrix values, which are often derived from other measurements, is crucial to the density porosity computation. An incorrect Pmatrix input or a mixture of rock types will yield an incorrect density porosity measurement. The same is true for the Pfluid input.
Neutron porosity tools emit high-energy fast neutrons (on the order of 106 eV) from chemical or electronic sources (Figure 3). Neutrons, which are neutrally charged subatomic particles, lose energy when they collide with nuclei of formation materials. The energy loss is related to the relative mass of the particles with which the neutron collides. Hydrogen, which consists of a nucleus with a single proton, is the most effective element for slowing fast neutrons. In reservoir rocks, hydrogen is associated with the liquids—oil or water—that fill the pore space. Gas has a much lower hydrogen density than oil and water.
Figure 3. Life of a fast neutron. The neutron sends out high-energy neutrons that collide with molecules in the formation rocks and fluids, lose energy (right) and eventually reach thermal energy level (0.025 eV) in a region some distance of the thermal neutrons return to the tool where the detectors. These counts are converted into a hydrogen index (HI) measurement, which is used to compute neutron porosity. Thermal neutrons are eventually captured by elements in the formation.
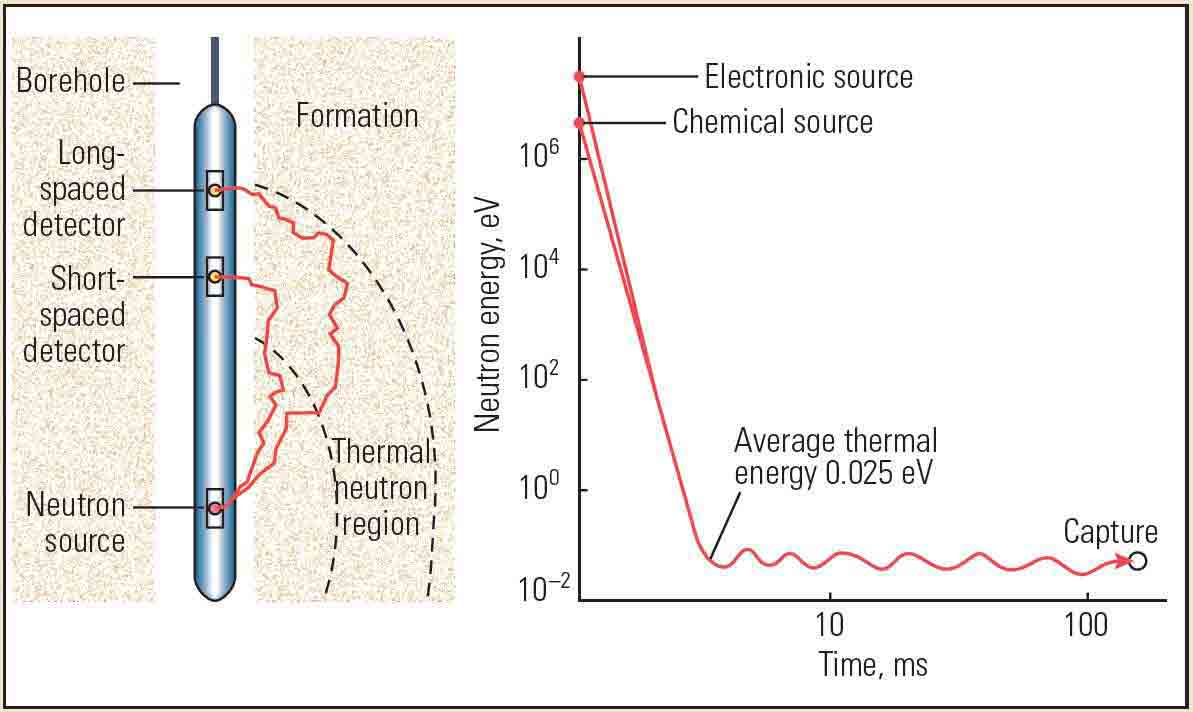
After multiple collisions, the neutrons achieve a low energy state (0.025 eV) and are referred to as thermal neutrons. The number of thermal neutrons resulting from collisions with hydrogen is proportional to the hydrogen index (HI) of the formation.
A conventional neutron porosity tool has two detectors located fixed distances from the source. The detectors count neutrons that have passed through the formation and attained thermal energy levels. The HI is derived from the ratio of counts from these two detectors, and analysts apply a lithology-dependent transform to convert HI to neutron porosity. As with the density porosity, obtaining accurate neutron porosity depends on using the correct matrix.
For clean, shale-free formations, in which the porosity is filled with water or oil, the neutron log measures the fluid-filled porosity. Because gas has a much lower hydrogen density than oil or water, gas-filled porosity appears as low porosity.
Several environmental factors affect neutron porosity measurements and corrections have been developed to compensate for them. These include borehole size, mud weight and salinity, mudcake thickness, hydrostatic pressure, formation salinity and temperature.
Complementary Measurements
Porosity tools respond in well-defined ways to the physical attributes of fluids and rocks. As part of the log interpretation process, log analysts account for these different responses. Two of the most easily recognized examples of tool responses are the shale effect and the neutron-density gas effect (Figure 4).
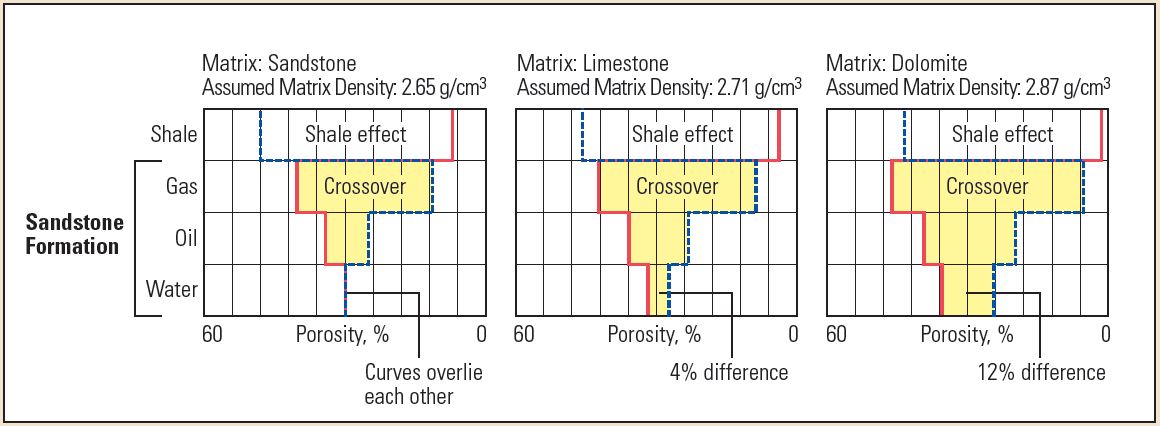
In clean rocks filled with water, the density and neutron porosity logs should overlie each other if the correct lithology input is applied. When shale is present, the neutron porosity measurement is higher than the density porosity. This results from the neutron responding to the large volume of fluid adsorbed by the shale. The net effect is that, in shales, there is a separation between the density and neutron porosity curve—the shale effect.
The effects of shale also give rise to another term—effective porosity. Petrophysicists derive total porosity values by combining different measurements and correcting for environmental and lithologic conditions. This total porosity includes fluids associated with shale. Because the fluids in shales cannot usually be produced, their contributions to the measurement can be subtracted from the total porosity. By quantifying the shale contribution and removing it from the total porosity measurement, log analysts are able to compute the effective porosity, which more accurately portrays a reservoir's potential.
The gas effect results from two physical measurement principles. Gas-filled porosity is seen by the neutron porosity tool as low porosity. In contrast, the density porosity measurement may be higher than the true porosity. The result is that the density and neutron porosity curves are neither overlying each other—which would indicate water- or oil-filled porosity and the correct matrix—nor separated from each other, the shale effect. Because the neutron porosity is lower than the density porosity, the curves cross over each other, giving rise to the term crossover.
The shale effect counteracts the crossover effect; however, petrophysicists use other measurements to correct for the shale volume and determine the effective porosity. The gas effect can also be masked by the presence of deep invasion when drilling fluid filtrate displaces the original gas in place. Logging-while-drilling (LWD) tools, which acquire data before invasion takes place, may identify the presence of gas zones that are missed by wireline tools, which are run some time after drilling.
Other measurement techniques can be used to determine porosity. These include nuclear magnetic resonance (NMR) tools and core samples. An NMR tool directly measures liquid-filled porosity. Core data provide an empirical porosity value, although damage during the core recovery process may affect the measured value.
Crucial Parameter
Porosity is one of the most critical parameters for quantifying hydrocarbon reserves. Petrophysicists have developed numerous ways to determine porosity to make sure they have the most accurate data possible. The ultimate goal is to use these data to understand a reservoir's production potential and ensure that its hydrocarbons are effectively recovered.