


ExploreCube™ rapid frontier intelligence
Advanced, AI-powered tool for frontier exploration.
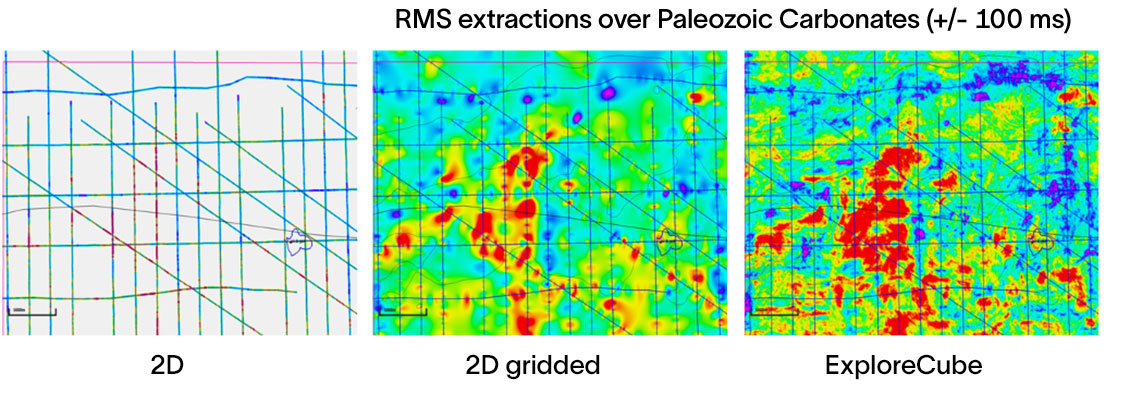
Unlock basin geometry insights with our multiclient datasets—produced using hybrid, self-supervised machine learning 3D projection from 2D seismic data.