The Defining Series: Basic Well Log Interpretation
Published: 07/28/2016

The Defining Series: Basic Well Log Interpretation
Published: 07/28/2016
Well logs present a concise, detailed plot of formation parameters versus depth. From these plots, interpreters can identify lithologies, differentiate between porous and nonporous rock and quickly recognize pay zones in subsurface formations. The ability to interpret a log lies in recognizing the significance of each measurement.
Logging tools record the magnitude of a specific formation property, such as resistivity, measured as the tool traverses an interval defined by depth; a well log is a chart that shows the value of that measurement plotted versus depth. During the early days of commercial well logging, logs were primarily used qualitatively for making formation correlations; within a given field or local geological province, certain formations have distinctive characteristics that appear remarkably similar from one well to the next, providing geologists with a basis for locating the depths of various strata in the subsurface. In 1942, the relationship between resistivity, porosity and water saturation (and thus its inverse: hydro-carbon saturation) was established by G.E. Archie, paving the way for a quantitative evaluation of formation properties using well logs.
Early electric logs, or e-logs, plotted only formation resistivity measurements. The resistivity of a rock is a measure of the degree to which it can impede the flow of an electric current. It is measured in ohm.m2/m, which is usually referred to simply as ohm.m. The reciprocal of resistivity is conductivity, which is typically expressed in terms of millimhos or mmhos. The ability to conduct electrical current is a function of the conductivity of the water contained in the pore space of the rock. Fresh water does not conduct electricity; however, the salt ions found in most formation waters do. Thus, unless that water is fresh, water-saturated rocks have high conductivity and low resistivity. Hydrocarbons, which are nonconductive, cause resistivity values to increase as the pore spaces within a rock become more saturated with oil or gas.
The spontaneous potential (SP) log was developed next and was presented along with resistivity logs. It is a measurement of the voltage difference between a movable electrode in the wellbore and a fixed electrode at the surface. This electrical potential is primarily generated as a result of exchanges of fluids of different salinities—those of the mud system and those in the formation. During the course of drilling, permeable rock within the wellbore becomes invaded by drilling mud filtrate. If the filtrate is less saline than the formation fluids, negatively charged chlorine ions from the formation water cause the SP curve to deflect to the left from an arbitrary baseline established across impermeable shale formations. The magnitude of the deflection is influenced by a number of factors, including permeability, porosity, formation water salinity and mud filtrate properties. Permeable formations filled with water that is fresher than the filtrate will cause the curve to deflect to the right. So, simply by the nature of its deflections, the SP curve can indicate to a geologist which formations are permeable. A permeable formation with a high resistivity is more likely to contain hydrocarbons.
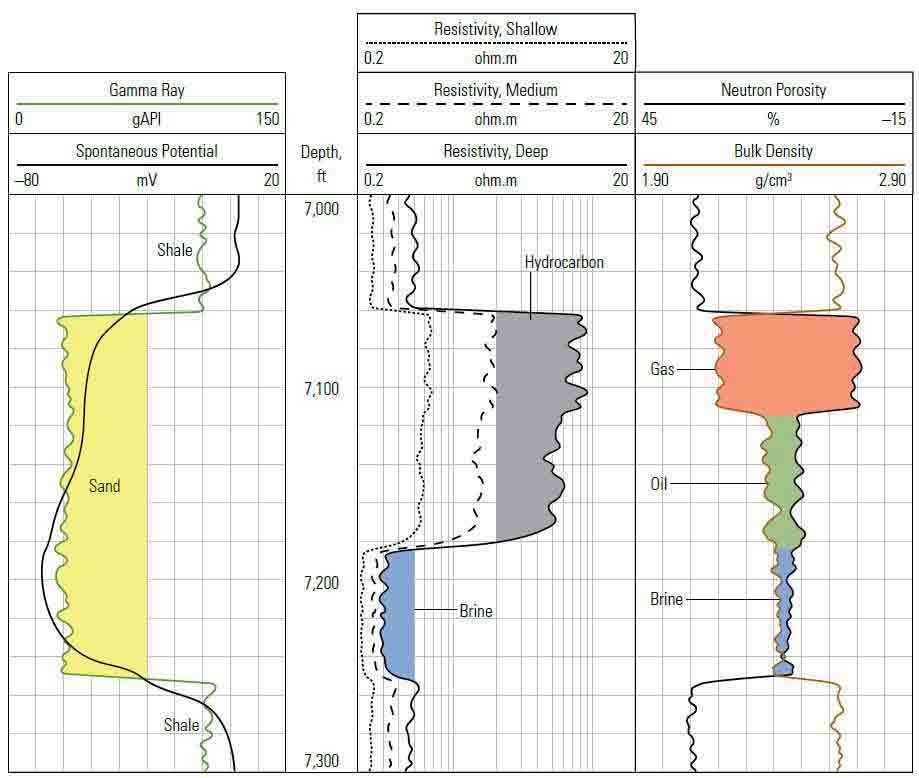
Over time, the measurements that constitute electric logs have been substantially refined and expanded upon. In addition to the SP curve, today's basic suite of logging measurements includes a gamma ray (GR) curve, multiple resistivity curves, as well as porosity readings obtained from density, neutron and sonic tools.
The GR device measures naturally occurring radioactivity from the formation, and a GR log helps geologists differentiate nonreservoir rocks—shales and clays—from reservoir rocks, such as sandstone and carbonates. Shales and clays are derived from rocks that tend to contain naturally occurring radioactive elements, primarily potassium, uranium and thorium. As a consequence, shales and clays are more radioactive than clean sand-stones and carbonates. Quartz and calcium carbonate produce almost no radiation. Log analysts look for formations with low background radiation because they have the potential to contain moveable hydrocarbons.
Resistivity tools measure the formation at different depths of investigation. The resulting log presents shallow-, medium- and deep-reading curves. The shallow curve, charting the smallest radius of investigation, shows the resistivity of the flushed zone surrounding the borehole. The medium curves indicate the resistivity of the invaded zone. The deepest curves show the resistivity of the uncontaminated zone, which is presumed to be the true resistivity, although even the deepest reading curves may be affected by the presence of mud filtrate. By evaluating the separation between these curves, a geologist can estimate the diameter of invasion by the mud filtrate and may be able to determine which zones are more permeable than others.
Formation bulk density provides a key measure of porosity. The bulk density (rhob or Pb) of a formation is based on the ratio of a measured interval's mass to its volume. In general, porosity is inversely related to the density of the rock. The Pb measurement is derived from the electron density of a formation. This measurement is obtained by a logging device that emits gamma rays into the formation. The gamma rays collide with electrons in the formation, giving off energy and scattering in a process known as Compton Scattering. The number of such collisions is directly related to the number of electrons in the formation. In low-density formations, more of these scattered gamma rays are able to reach the detector than in formations of higher density.
Because hydrogen is a major constituent of both water and hydrocarbons and because water and hydrocarbons concentrate in rock pores, the concentration of hydrogen atoms can be used to determine the fluid-filled porosity of a formation. Hydrogen atoms have nearly the same mass as neutrons. Neutron logging tools emit neutrons using a chemical source or an electronic neutron generator. When these neutrons collide with hydrogen atoms in a formation, they lose the maximal energy, slow down and eventually reach a very-low-energy—or thermal—state. The rate at which neutrons reach the thermal state is proportional to the hydrogen concentration or index (HI). Neutron porosity tools measure the HI, which is then converted to neutron porosity.
The sonic log may be used to determine porosity by charting the speed of a compressional sound wave as it travels through the formation. Interval transit time (∆t), measured in microseconds per meter [foot] and often referred to as slowness, is the reciprocal of velocity. Lithology and porosity affect ∆t. Dense, consolidated formations characterized by compaction at depth generally result in a faster (shorter) ∆t while fluid-filled porosity results in a slower (longer) ∆t.
Measurements are also uniquely affected by formation and borehole conditions. Log analysts perform quality control on the data and determine what corrections are required before carrying out quantitative analysis of the data. For example, gas, fractures and lack of compaction require corrections to be applied to the sonic log. Lithologies affect the density, neutron and sonic logs. Invasion of mud filtrate into porous formations affects resistivity readings, and temperature affects the resistivity of both filtrate and saline formation water. Some resistivity tools work in nonconductive bore-hole fluids, others only work in salt saturated mud systems. Pad-contact logging tools may be affected by borehole washouts. If data are compromised by hole conditions, analysis may not be possible.
Figuring It All Out
An initial review of the log should identify deviations from baseline trends that could indicate changes in lithology, fluid content, porosity or borehole diameter. Recognizing the significance of such deviations is the key to determining which intervals on the well log merit further analysis. For example, a deflection of the GR curve to the left of the baseline established for shales might indicate a sandstone that warrants additional evaluation. When accompanied by increases in resistivity and porosity, this interval should be scrutinized more thoroughly. A particularly useful indicator for gas is the telltale decrease in neutron porosity, which can cause the neutron curve to cross over the density curve. This gas effect is created because gas contains fewer hydrogen atoms than oil or water.
After a potential pay zone is identified, it must be analyzed to determine porosity and hydrocarbon saturation. The neutron porosity is transformed from the HI measurement. To evaluate porosity (Ø) from ρb or ∆t measurements, the log analyst must factor in the respective densities or interval transit times of the rock matrix and the drilling fluid

The equation for converting the sonic measurement to porosity is similar.

Having established the porosity of the zone of interest, the next step is to determine its true resistivity and the resistivity of a nearby interval containing water. True resistivity (Rt) is based on the deep reading resistivity measurement, corrected for filtrate invasion. A nearby water-bearing interval can be used to compute the water resistivity Rw. These readings may be combined in the formula developed by Archie to calculate the water saturation Sw in the pore spaces of a rock.

The values for a, m and n are often based on the formation properties. After Sw is computed, the log analyst can arrive at a hydrocarbon saturation by subtracting that value from 1.
Initially all logs were obtained from logging tools lowered into the well-bore using a logging cable. Today sensors embedded in the drill collars of MWD and LWD toolstrings provide alternatives to wireline tools. Although manual interpretation of log data is still common, log evaluation has also evolved beyond calculations using Archie's water saturation equation. Modern log analysis is more frequently carried out using computers. With the proliferation of production from unconventional reservoirs, more information is required to properly evaluate and complete these formations. As such, computer processing has become an essential element in log interpretation.