The Defining Series: Defining and Determining Permeability
Published: 09/09/2015

The Defining Series: Defining and Determining Permeability
Published: 09/09/2015
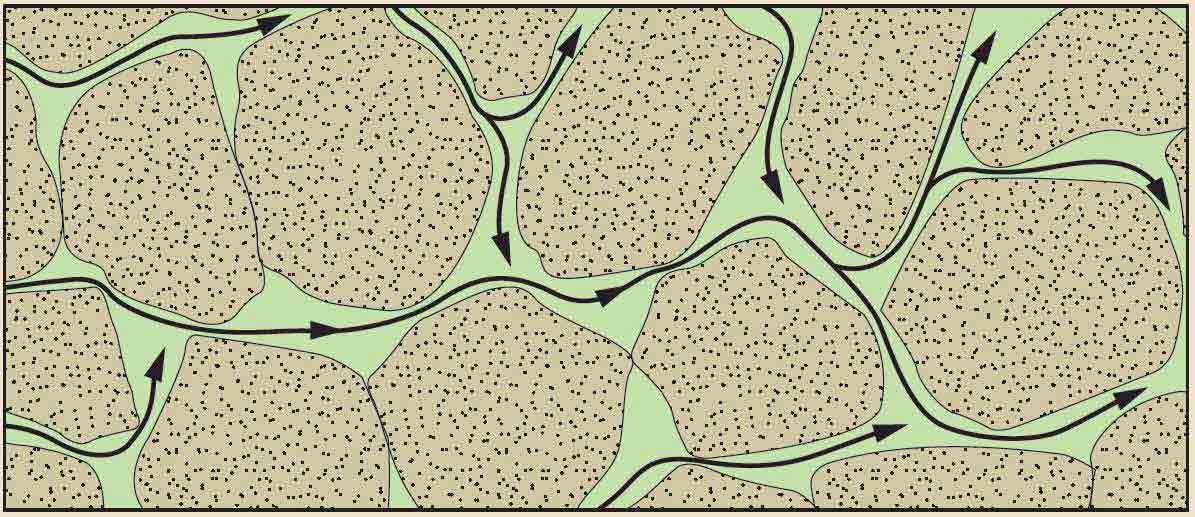
Permeability, which is the capacity of a porous material to allow fluids to pass through it, depends on the number, geometry and size of interconnected pores, capillaries and fractures (Figure 1). Permeability is an intrinsic property of porous materials and governs the ease with which fluids move through hydrocarbon reservoirs, aquifers, gravel packs and filters.
Permeability is defined in units of area, which relates to the area of open pore space in the cross section that faces, or is perpendicular to, the direction of flowing fluid. In the International System of Units (SI), the unit for permeability is m2. The common unit is the darcy (D) [about 10–12 m2]; this unit is named for the French engineer Henry Darcy, who conducted experiments with water flowing through sand. These experiments led to the formulation of Darcy's law, which describes the steady-state flow of fluid through porous media. In most oilfield applications, the common unit is the millidarcy (mD) [about 10–15 m2].
Permeability is not to be confused with mobility or with hydraulic conductivity. Mobility is the medium's permeability divided by the dynamic viscosity of the fluid flowing through the medium. Hydraulic conductivity, or transmissivity, is the discharge, or effective, velocity of fluid flow through the medium and is equal to the fluid flux—volume of fluid passing through a cross section during a time interval—divided by the cross-sectional area. Mobility and hydraulic conductivity are collective characteristics that combine properties of the fluid with those of the porous medium.
Factors Affecting Permeability
In many materials, permeability is almost directly proportional to the material's porosity, which is the fraction of the material's total volume that is occupied by pores, or voids. However, this is not an absolute rule. Textural and geologic factors determine the magnitude of permeability by increasing or decreasing the cross-sectional area of open pore space. These factors affect the geometry of the pore space and are independent of fluid type.
Materials formed from stacked arrays of identical solid spheres, be they cannonballs, marbles or ball bearings, have equal porosities. However, the pore cross-sectional areas differ dramatically; thus the permeabilities of these arrays also differ dramatically. The permeability for rocks made of large, or coarse, grains will be higher than those of small, or fine, grains (Figure 2).
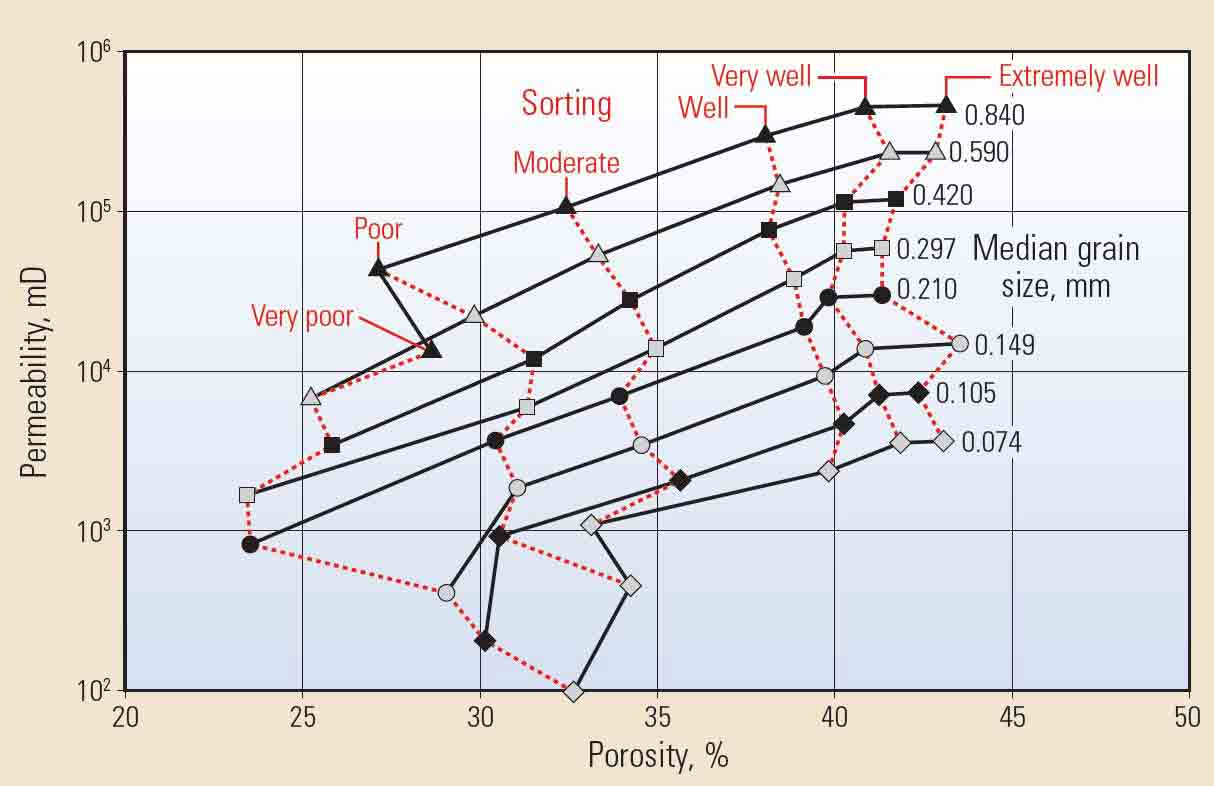
Sorting is the range of grain sizes that occurs in sedimentary materials. Well-sorted materials have grains of the same size, while poorly sorted materials have grains of many sizes. Permeability decreases as the degree of sorting varies from good to poor because small grains can fill the spaces between large grains.
Permeability is also influenced by grain shape. Measures of grain shape are sphericity, roundness and roughness. Sphericity is the degree to which a grain's shape approximates that of a sphere. Roundness relates to the amount of smoothing of the grain surface, ranging from angular to round. Roughness is the degree of texture on grains. Grain shape affects packing, the 3D arrangement of grains. Variability in grain shape can prevent grains from reaching their closest possible packing arrangement, which has an impact on permeability. As the degree of packing increases from loose to tight, a single grain contacts an increasing number of neighboring grains. Consequently, the spaces between grains and the cross-sectional areas open to flow decrease, leading to lower permeability.
Diagenesis is the alteration of a rock's original mineralogy and texture. Dissolution, dolomitization, fracturing or other rock-altering processes create additional, or secondary, porosity that may increase permeability. Precipitation of cement between mineral and rock grains decreases permeability. Clay minerals may form crystals that line pore walls or grow as fibers and plates that bridge the pore volume. Authigenic interstitial clays, those that develop in place between grains, may fill pore space and reduce permeability. Allogenic clays, those that have been transported into pores, can plug them.
Stress and pressure increase as rocks are buried deep in sedimentary basins. In response, the rock's bulk and pore volumes are compressed, causing permeability to decrease. Fluid pressures also affect permeability; an increase in fluid pressure opens pores, while a decrease causes pores to close.
Most rocks exhibit some degree of permeability anisotropy, which is the variation of permeability with direction. Grain sphericity and the presence of fractures are factors that affect the directionality of permeability. Spherical grains form isotropic packs that allow fluid to flow equally well in all directions. Oblate (flattened) and prolate (elongated) grains tend to rest horizontally and parallel to one another and form layers that affect the ease of fluid flow. Anisotropic permeability is higher when fluids flow parallel to a layer than when perpendicular to it. Fluids flow more easily through open fractures than between grains. If the fractures have a preferred alignment, permeability is highest parallel to this direction and is anisotropic.
As a consequence of the textural and geologic factors that influence permeability, the path that fluid takes through rock may be longer, with many turns and bends, than the direct linear distance between start and end points (Figure 3). Tortuosity is the ratio of the actual distance traveled divided by the straight-line distance. Permeability is inversely proportional to tortuosity.
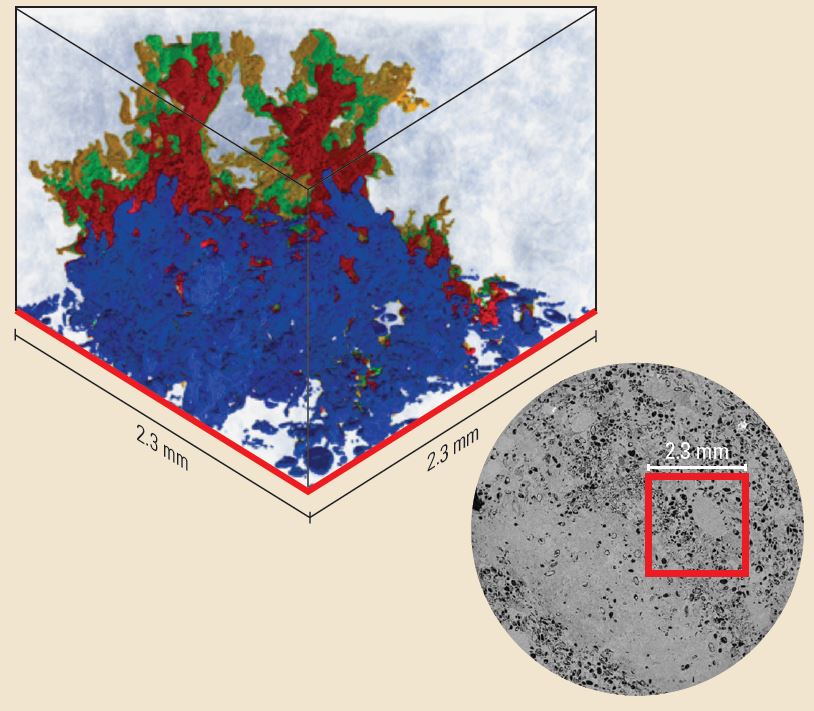
Figure 3. Tortuosity and hydrodynamic pore flow simulation. Engineers conducted a hydrodynamic pore flow simulation (left) of a tracer test through limestone. The grains are transparent in the model, and the pore space is saturated with brine (light blue). Flow starts at the bottom. Four steps of the tracer test are shown; from earliest to latest, the steps are colored blue, red, green and gold. The flow path of the tracer is controlled by the tortuosity of the interconnected pore space. The digital rock model was obtained from a core plug of limestone; a 2D grayscale X-ray image used to construct the 3D model is on the right. The model was coupled with digital fluid descriptions to simulate reservoir flow. The limestone sample had 16% porosity and 12-mD permeability.
Measuring Permeability
Permeability can be measured in the laboratory and indirectly determined in the field. In the laboratory, analysts flow a single-phase fluid through a rock core of known length and diameter. The fluid has known viscosity and flows at a set rate. When the flow reaches steady state, an analyst measures the pressure drop across the core length and uses Darcy's law to calculate permeability. For routine core analysis, the fluid may be air, but is more often an inert gas, such as nitrogen or helium.
In an alternative laboratory method, analysts apply gas pressure to the upstream side of a sample and monitor as the gas flows through the sample and the pressure equilibrates with the downstream pressure. During this unsteady-state, or pressure-decay, procedure, analysts use the time rate of change of pressure and effluent flow rate to solve for permeability. The pressure-decay method is particularly good for measuring the permeability of tight, or low-permeability, samples because steady-state flow through these samples takes a long time to achieve.
Analysts apply corrections to compensate for differences between laboratory and downhole conditions. They account for stress differences by applying confining stress to one or more representative plug, or core, samples. To determine stress-related effects on permeability, analysts often use several confining stresses on a few samples and then apply a correction factor for the reservoir confining stress to the other samples.
Gas flow in pores is faster than liquid flow because liquids experience greater flow resistance, or drag, at pore walls than do gases. This gas slippage, or higher flow rate of gases compared with liquids, is an effect that can be corrected by incrementally increasing the mean gas pressure in the plug, which compresses the gas and increases its drag at the pore wall. The Klinkenberg correction is an extrapolation of these measurements to infinite gas pressure, at which point gas is assumed to behave like a liquid.
In the field, permeability can be estimated in the near-wellbore region using well logging data. The primary logging data come from nuclear magnetic resonance (NMR) tools. Permeability estimates from NMR measurements require knowledge of the empirical relationship between the computed permeability, porosity and pore-size distribution; estimates are often calibrated to direct measurements on core samples from the well or from nearby wells. Permeability may also be determined from downhole pressure and sampling tool measurements.
Permeability on the reservoir scale is typically determined with drillstem tests (DSTs). Pressure transient analysis from DSTs assesses the aver-age in situ permeability of the reservoir. To match the transient behavior to that predicted by a formation model, interpreters use several techniques. They can estimate an average effective permeability from the flow rate and pressure during steady-state production measured during specific tests at established flow rates. An average permeability can also be calculated from production-history data by adjusting permeability until the correct history of production is obtained.
Multiphase Flow
Permeability in a porous medium that is 100% saturated with a single-phase fluid is the absolute permeability, or synonymously, the intrinsic permeability or specific permeability.
Multiphase flow is the simultaneous flow of multiple fluids in a porous material partially saturated with each fluid. Each fluid phase flows at its own rate and competes for flow paths with the other phase or phases. Its admittance through the porous space is determined by its effective permeability, or phase permeability. The fractional flow of each fluid is related to its relative permeability, which is the ratio of the fluid's effective permeability divided by a reference value, typically the absolute permeability.
Multiphase flow is also affected by wettability, which is the preference that solids have to be in contact with one fluid phase rather than another. Wetting affects the local distribution of phases, which has an impact on their relative abilities to flow.
Permeability is the simplest measure of the producibility and injectivity of subsurface formations. In formations of sufficient permeability, operations such as producing fluid hydrocarbons or water, conducting secondary and tertiary recovery and sequestering carbon dioxide can be accomplished.