The Defining Series: Rheology
Published: 03/15/2016

The Defining Series: Rheology
Published: 03/15/2016
Given sufficient time and force, all substances—solids, liquids or gases—eventually flow. Rheology is the study of how materials flow as a function of shear—or load—rate, time and spatial orientation. Temperature, pressure, and the rate and duration of shear may affect the rheological properties of a material.
Rheological characterization is particularly important for the oil and gas industry. Rheology affects produced fluids, drilling fluids, cement, workover fluids and completion fluids. Rheology affects heavy oil production because high viscosity makes heavy oil difficult to produce. In deepwater environments, cold temperatures and high pressures create flow problems that complicate oil transportation through pipelines.
In the oil field, petroleum engineers are concerned primarily with key rheological characteristics of fluids. Viscosity is the measure of a fluid’s resistance to flow. Shear stress, which is expressed in units of force per unit area, is a function of the shear rate. Shear rate is the fluid’s velocity gradient measured perpendicular to the direction of flow. Viscosity, time and pressure affect how fluids flow.
The science of rheology is particularly important to the study of the flow behavior of solids suspended in fluids in pipes and flowlines. Flow behavior can be characterized as laminar or turbulent. Laminar flow dominates at low velocities, in which flow is orderly, parallel and without crossflow and is characterized by theoretical flow equations that are functions of the viscous properties of the fluid. In contrast, turbulent flow prevails at high velocities, in which flow is chaotic, disorderly and characterized by empirical flow equations.
Rheological models
Rheological models used to characterize fluid flow in the oil field are typically classified as Newtonian or non-Newtonian. The Newtonian model describes the simplest fluid flow behavior; the fluid viscosity is the linear constant of proportionality between shear stress and shear rate under conditions of constant temperature and pressure. Newtonian fluids start to flow immediately, and the shear stress increases as shear rate increases. Many fluids, including water, oil, gasoline, alcohol and glycerin, behave as Newtonian fluids; their viscosity is a function only of the condition of the fluid and its temperature. For Newtonian fluids, a plot of shear stress versus shear rate produces a straight line that runs through the origin of the plot coordinates, and the slope of the line is termed the Newtonian, or dynamic, viscosity of the fluid (Figure 1).
Figure 1. Rheological models. Fluids are described as Newtonian or non-Newtonian based on their response to shear rate. Most drilling fluids are classified as non-Newtonian. The shear stress of a Newtonian fluid is linearly proportional to the shear rate; the constant of proportionality, or the slope, defines the Newtonian viscosity. Bingham plastic fluids and Herschel-Bulkley fluids require a certain minimum shear stress, called the yield stress, to initiate flow. The slope of the Bingham plastic curve is the plastic viscosity. The curvature of the power-law and Herschel-Bulkley lines is controlled by a consistency factor and a power-law exponent.
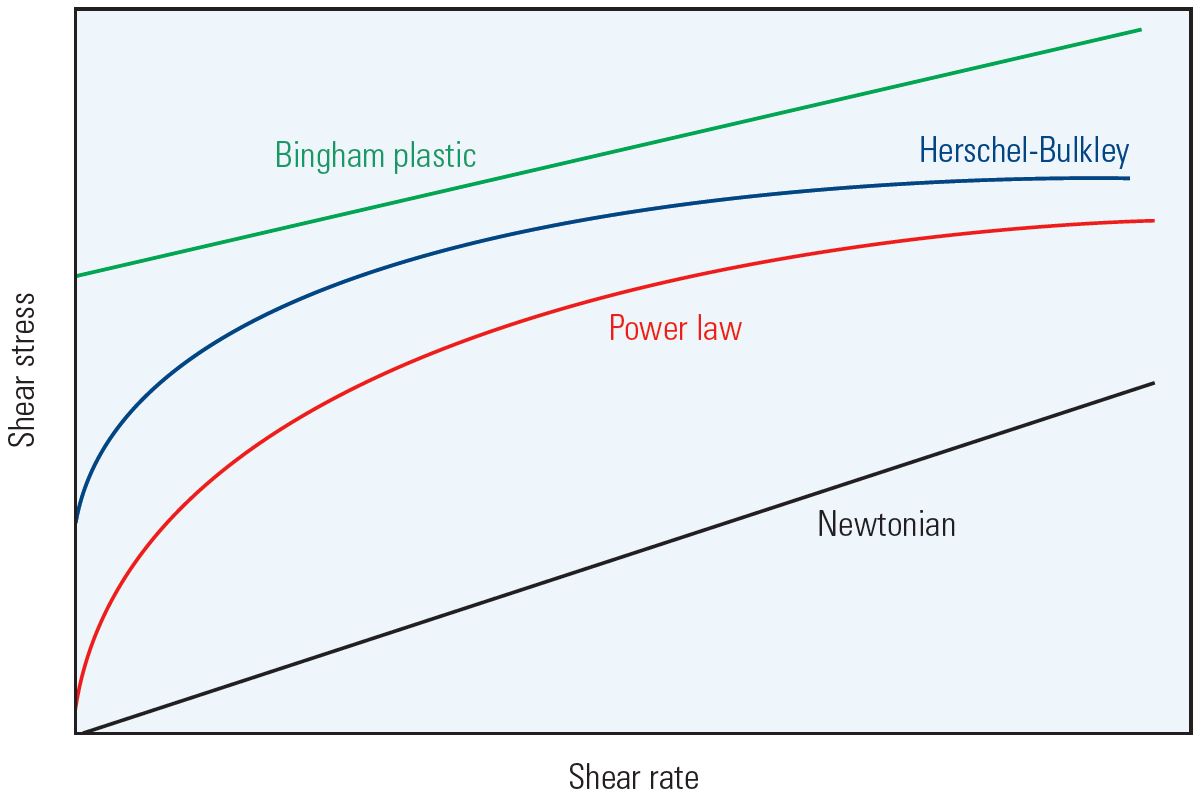
Most fluids are non-Newtonian. For these fluids, no constant of proportionality exists between shear stress and shear rate; their viscosity varies with changing shear rate.
Non-Newtonian fluids are separated further into subcategories defined by various models. The models of most interest in drilling fluid technology are the Bingham plastic, power-law and Herschel-Bulkley models. Most fluids do not conform precisely to a single model but rather to a combination of models.
The behavior of many drilling fluids, and most water-base cement slurries, can be described by the two-parameter Bingham plastic model, which assumes a linear relationship between the shear stress and the shear rate. Fluids that exhibit Bingham plastic behavior do not flow until the shear stress exceeds a critical value known as the yield point. Once the yield point is reached, changes in shear stress and shear rate are proportional. This constant of proportionality, or the slope of the curve, is termed the plastic viscosity. The Bingham plastic model does not accurately predict fluid flow behavior at low shear rates but is useful for continuous monitoring and treating of drilling fluids.
Unlike the Bingham plastic model, the power-law model assumes a non-linear relationship between the shear stress and the shear rate. For power-law fluids, the shear stress increases as a function of the shear rate raised to a constant exponent. This model is a good fit for fluids when measured at low shear rates. Power-law fluids do not have a yield point and do not develop gel strengths—in which they maintain suspensions—when left undisturbed. Polymeric solutions and melts are examples of fluids that exhibit power-law behavior.
The Herschel-Bulkley model combines the effects of Bingham and power-law behavior in a fluid; the model is applied to fluids that have a yield stress and a nonlinear relationship between the shear stress and the shear rate.
Most non-Newtonian fluids are sensitive to shear rate. Some non- Newtonian fluids are useful in the oil industry because their viscosities decrease with increasing shear rate but then increase, or gel, when shear ceases. The ongoing increase in gel strength, which depends on how long the fluid has been at rest, is an indication of thixotropy. These fluids are termed thixotropic fluids and exhibit time-dependent changes in viscosity; the longer the duration of shear, the lower the fluid’s viscosity until it eventually reaches a constant value. Some cements, such as gypsum and port-land and clay-based cement formulations, are thixotropic. Thixotropic cement is commonly used in wells in which fractures and lost circulation are concerns. When sheared, these cements exhibit low viscosities, but if they enter a fracture in a formation and are no longer subjected to shear, they immediately start to gel and become self-supporting.
Measurements
To maintain control of hole cleaning, mud engineers measure the suspension and filtration properties of a drilling fluid at the rig site on a daily basis. The mud engineer conducts these tests following procedures in API RP 13-B1, Recommended Practice for Field Testing Water-Based Drilling Fluids, and API RP 13-B2, Recommended Practice Standard Procedure for Field Testing Oil-Based Drilling Fluids.
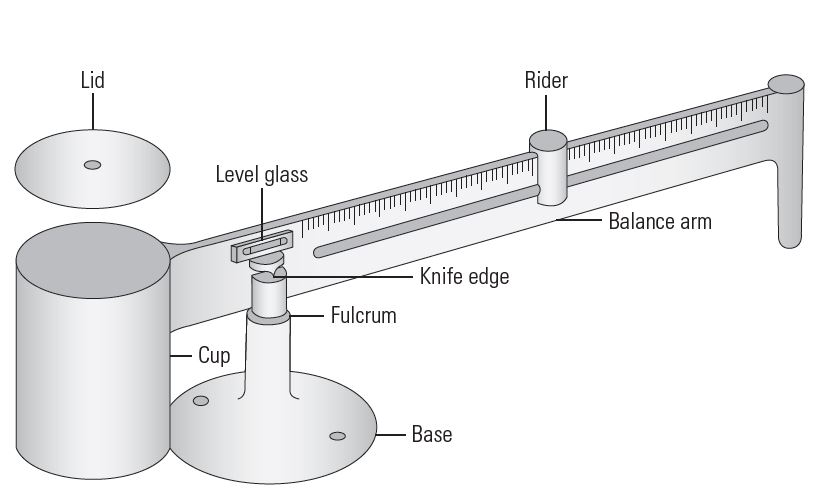
Drilling fluid density, often referred to as mud weight, is expressed as kilograms per cubic meter (kg/m3), pounds per gallon (lbm/galUS) or specific gravity (SG). Mud weight is typically measured by using a mud balance, which is a balance-beam scale (Figure 2). A cup of known volume and mass is attached to one end of the beam. Engineers fill the cup with drilling mud. The mass of the filled cup is balanced on the other end of the beam by a fixed countermass and a rider that can move freely along the graduated scale. The density of the fluid is read directly from the scales located on both sides of the mud balance.
Figure 2. Typical mud balance. The mud balance is used to measure the density of drilling fluids both at the rig site and the laboratory. After the cup of known volume and mass is filled with fluid and the lid is in place, the rider—an unfixed mass—is moved down the balance arm until the bubble in the level glass indicates that the arm is level. The density is read on the graduated arm at the point where the rider sits on the leveled arm.
Drilling fluids transport cuttings and debris to the surface and suspend weighting materials such as barite that are added to obtain the required drilling fluid density. The viscosity must be high enough to keep weighting materials suspended but also low enough to allow cuttings and sand to settle out and for entrained gas to escape at the surface. Mud engineers routinely use the Marsh funnel to monitor drilling fluid properties during drilling operations. The Marsh funnel is equipped with a graduated receiver cup that is used to measure funnel viscosity. The dimensions of the funnel allow 946 ml [1 qt] of fresh water that is at 21°C ± 3°C [70°F ± 5°F] to travel through the funnel into the receiver cup within a range of 0.5 s of 26 s.
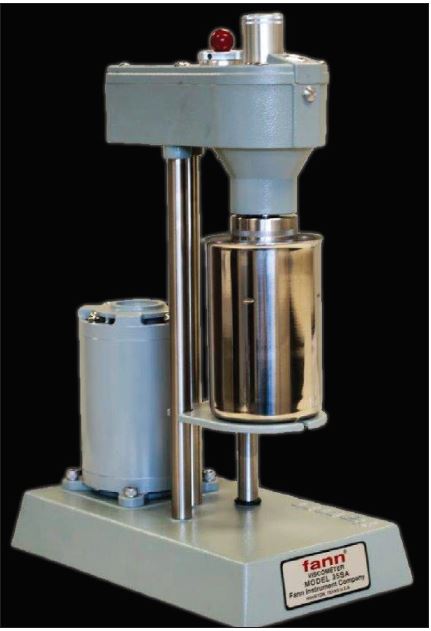
A rotational rheometer is typically used both at the rig site and in drilling fluid laboratories to measure fluid properties (Figure 3). The unit is equipped with a heating cup to allow measurements at temperatures from 20°C to 80°C [68°F to 176°F]. During testing, fluid is contained in the annular space between the solid bob and a rotating outer sleeve, which are both cylindrical. The sleeve rotates at a constant velocity measured in rotations per minute (rpm), whereby its movement induces the mud to exert a torque on the bob. A torsion spring restrains the movement of the bob. A dial attached to the bob indicates the bob’s displacement. The bob’s displacement values are calibrated to translate to shear stress values.
Figure 3. Rheometer. This rheometer is a coaxial cylinder, or Couette, rotational-type viscometer. It consists of an outer cylinder that rotates about an inner cylinder, or bob. Analysts place the test fluid in the gap between the cylinders. The outer cylinder rotates at known velocities. As it rotates, the fluid creates torque, in the form of shear stress, on the inner cylinder. The torque registers as deflections on a precision spring attached to the bob. The spring deflections are observed as direct readings off the display on top of the viscosmeter. Readings are commonly made at 600, 300, 200, 100, 6 and 3 rpm. The readings can be plotted on a chart of shear stress versus shear rate to determine the viscosity and appropriate viscosity model.
A drilling fluid’s gel strength, another important property, indicates the fluid’s potential to form a gel and the extent of gelling when circulation stops. Some amount of gelling is necessary in drilling fluids to keep cuttings from settling to the bottom of the hole. Gel strength is measured using a rheometer and is expressed in units of lbf/ft2. After 10 s, 10 min or 30 min of static conditions (no rotation), the rotation is set to 3 rpm and the gel strength is recorded as the maximum dial deflection. Normally, initial gel (10-s) and 10-min gel strengths are reported.
Although the procedures for measuring density and rheology are largely identical for all drilling fluids, some tests are specific for water-base or oil-base fluids. Additional tests for water-base fluids include: API filtration to measure fluid loss and mudcake buildup at the end of 30 min, sand content measurement, retort analysis to find liquid and solids content, and fluid pH and filtrate chemical analyses. Additional tests for oil-base fluids include high-pressure, high-temperature filtration to measure fluid loss and mud-cake buildup at the end of 30 min and an electrical stability test to determine the emulsion and oil-wetting qualities of the mud.
Future Flow
Whether to help characterize the flow of a well fluid or to adjust the mud weight of a drilling fluid, rheology is important in the oil and gas industry. The ability to measure, design and manage rheology in a timely manner is instrumental in enabling engineers to conduct operations in the field, including drilling, enhanced oil recovery, hydraulic fracturing stimulations, acid stimulations, wellbore cleaning and flow assurance.
Oilfield Review 2016.
Copyright © 2016 Schlumberger.
For help in preparation of this article, thanks to Louise Bailey, Cambridge, England.