Techlog Wellbore Software
Integration of all wellbore-centric data types into multidiscipline workflows
Integration of all wellbore-centric data types into multidiscipline workflows.

Sonic Scanner™ acoustic scanning platform accurately measures elastic properties axially, radially, and azimuthally to support geomechanical, geophysical, fracture, and petrophysical modeling.
The integration of multiple monopole and dipole transmitters with 13 receiver stations profiles formations in 3D while simultaneously obtaining a cement bond log (CBL) when run in cased holes.
Regardless of the formation type and slowness, the Sonic Scanner platform overcomes conventional acoustic measurement barriers through its wide frequency range, multiple monopole and dipole transmitter-receiver spacings, and full characterization.

Precise measurements lead to decisions that improve recovery and productivity.
Real-time quality control enables informed decisions and immediate action.
Advanced logging capabilities decrease operating time and eliminate extra runs.
A deeper understanding of the wellbore reduces uncertainty and operating risk.
Integrating data from acoustic measurements with wellbore images and reservoir testing, estimated pore pressures, stress magnitudes, and the fracture gradient refines the mud-weight window to avoid future drilling challenges. Layered shales and fractured formations are readily identifiable to enable drillers to better maintain wellbore stability.
Properly contained hydraulic fractures are designed by using continuous stress profiles based on acoustic measurements because they account for shale layering and differential stress. The accuracy of stress profiles is honed by calibration with dual-packer stress tests and maps of wellbore failure occurrences from breakouts and induced fractures.
Quantification of anisotropy in rock mechanical properties and determination of the maximum horizontal stress guide completion design for achieving optimal production, especially in highly deviated or horizontal wells accessing unconventional reservoirs or where sanding is a concern. Measurement of the extent of the alteration zone and damage effects is used to calculate the necessary perforation penetration, and achieving uniformity in perforation performance is based on understanding stress anisotropy.
Distinguishing drilling-induced from natural fractures and using shear wave anisotropy and Stoneley wave data in conjunction with images to identify existing fractures as open or closed are important considerations for designing completions, targeting hydraulic fracturing, and maximizing production.
Well velocity calibration accounts for shale layering and stress anisotropy to refine the time-depth conversion for more accurate analysis, tie-ins, and use in applications such as seismic inversion.
Simulating complex fracture networks relies on calibration based on acoustic measurements for differential stress, geomechanical strain, and any existing discrete fracture networks.
Sonic Scanner platform logging can be used to relate physical rock properties to seismic data to improve the value of data in modeling.
Our petrotechnical experts work with you to apply advanced interpretation techniques and workflows to deliver answers from measurements made with the Sonic Scanner acoustic scanning platform.
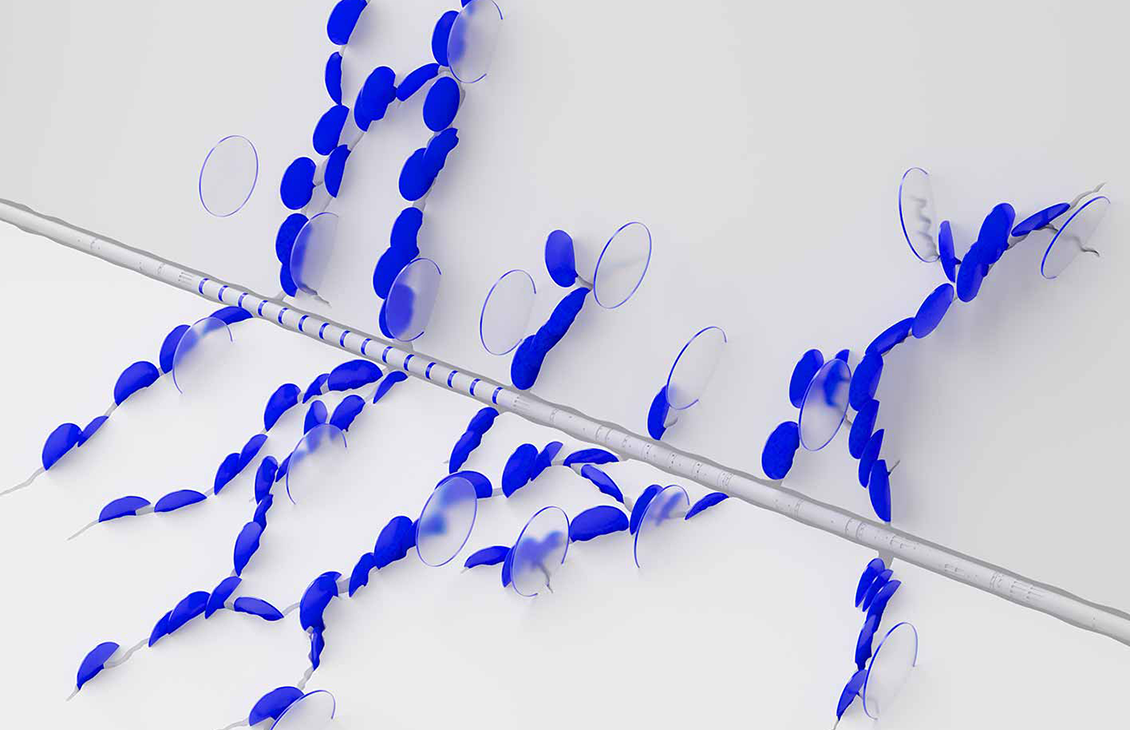
Advanced sonic waveform processing and analysis provide critical information for completion optimization, sanding prediction, wellbore stability studies, and mechanical earth models. Shear wave splitting and orientation of the fast shear azimuth guide lateral well placement, and Stoneley analysis can indicate and characterize fractures as well as reveal formation mobility.
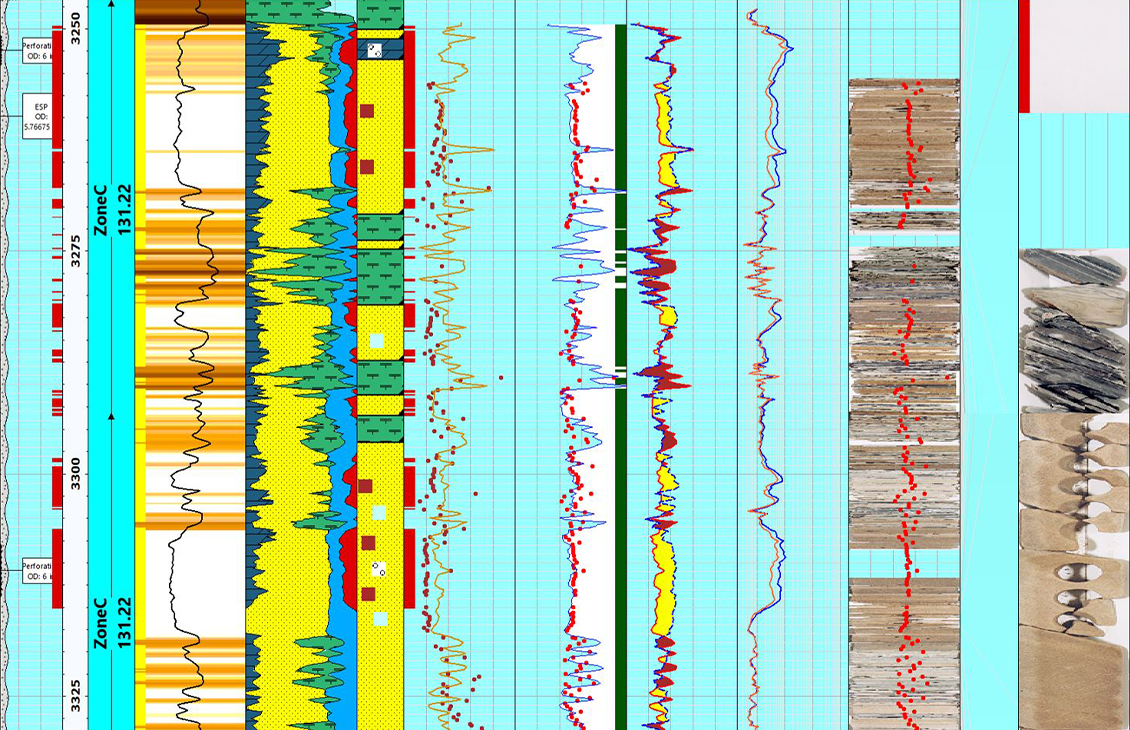
Data from the Sonic Scanner platform is acquired and ready for solutions through integrated Techlog™ wellbore software platform workflows for geomechanics, geophysics, fracture evaluation, and petrophysics.

Reimagine energy performance and improve decision making with connected, intelligent, and autonomous solutions.
Learn more