bp optimizes drainage of >100 million bbl of secondary oil via fiber optics
Optiq™ fiber-optic solutions provided a faster, more efficient way to monitor reservoir performance in highly deviated wells in the Caspian Sea. bp was able to optimize reservoir management and improve drainage without requiring interventions to run production logging tools.
Develop strategy to optimize drainage
bp was developing a portion of the Azeri-Chirag-Gunashli (ACG) oil field in the Caspian Sea offshore Azerbaijan. The main producing formations consisted of layers of sandstone interbedded with shale. More than 100 million bbl of secondary production were at risk of being bypassed because of the reservoir characteristics. The development and management strategies required a good understanding of the conformance between producer and injector wells, both by geography and formation. Use of conventional monitoring technologies, such as production logging tools, would have shut down production while the tool was being run in hole, increasing rig time and costs. The operator was seeking a faster, more efficient way to manage reservoir performance.
Use fiber optics to identify reservoir properties and calculate flow rate
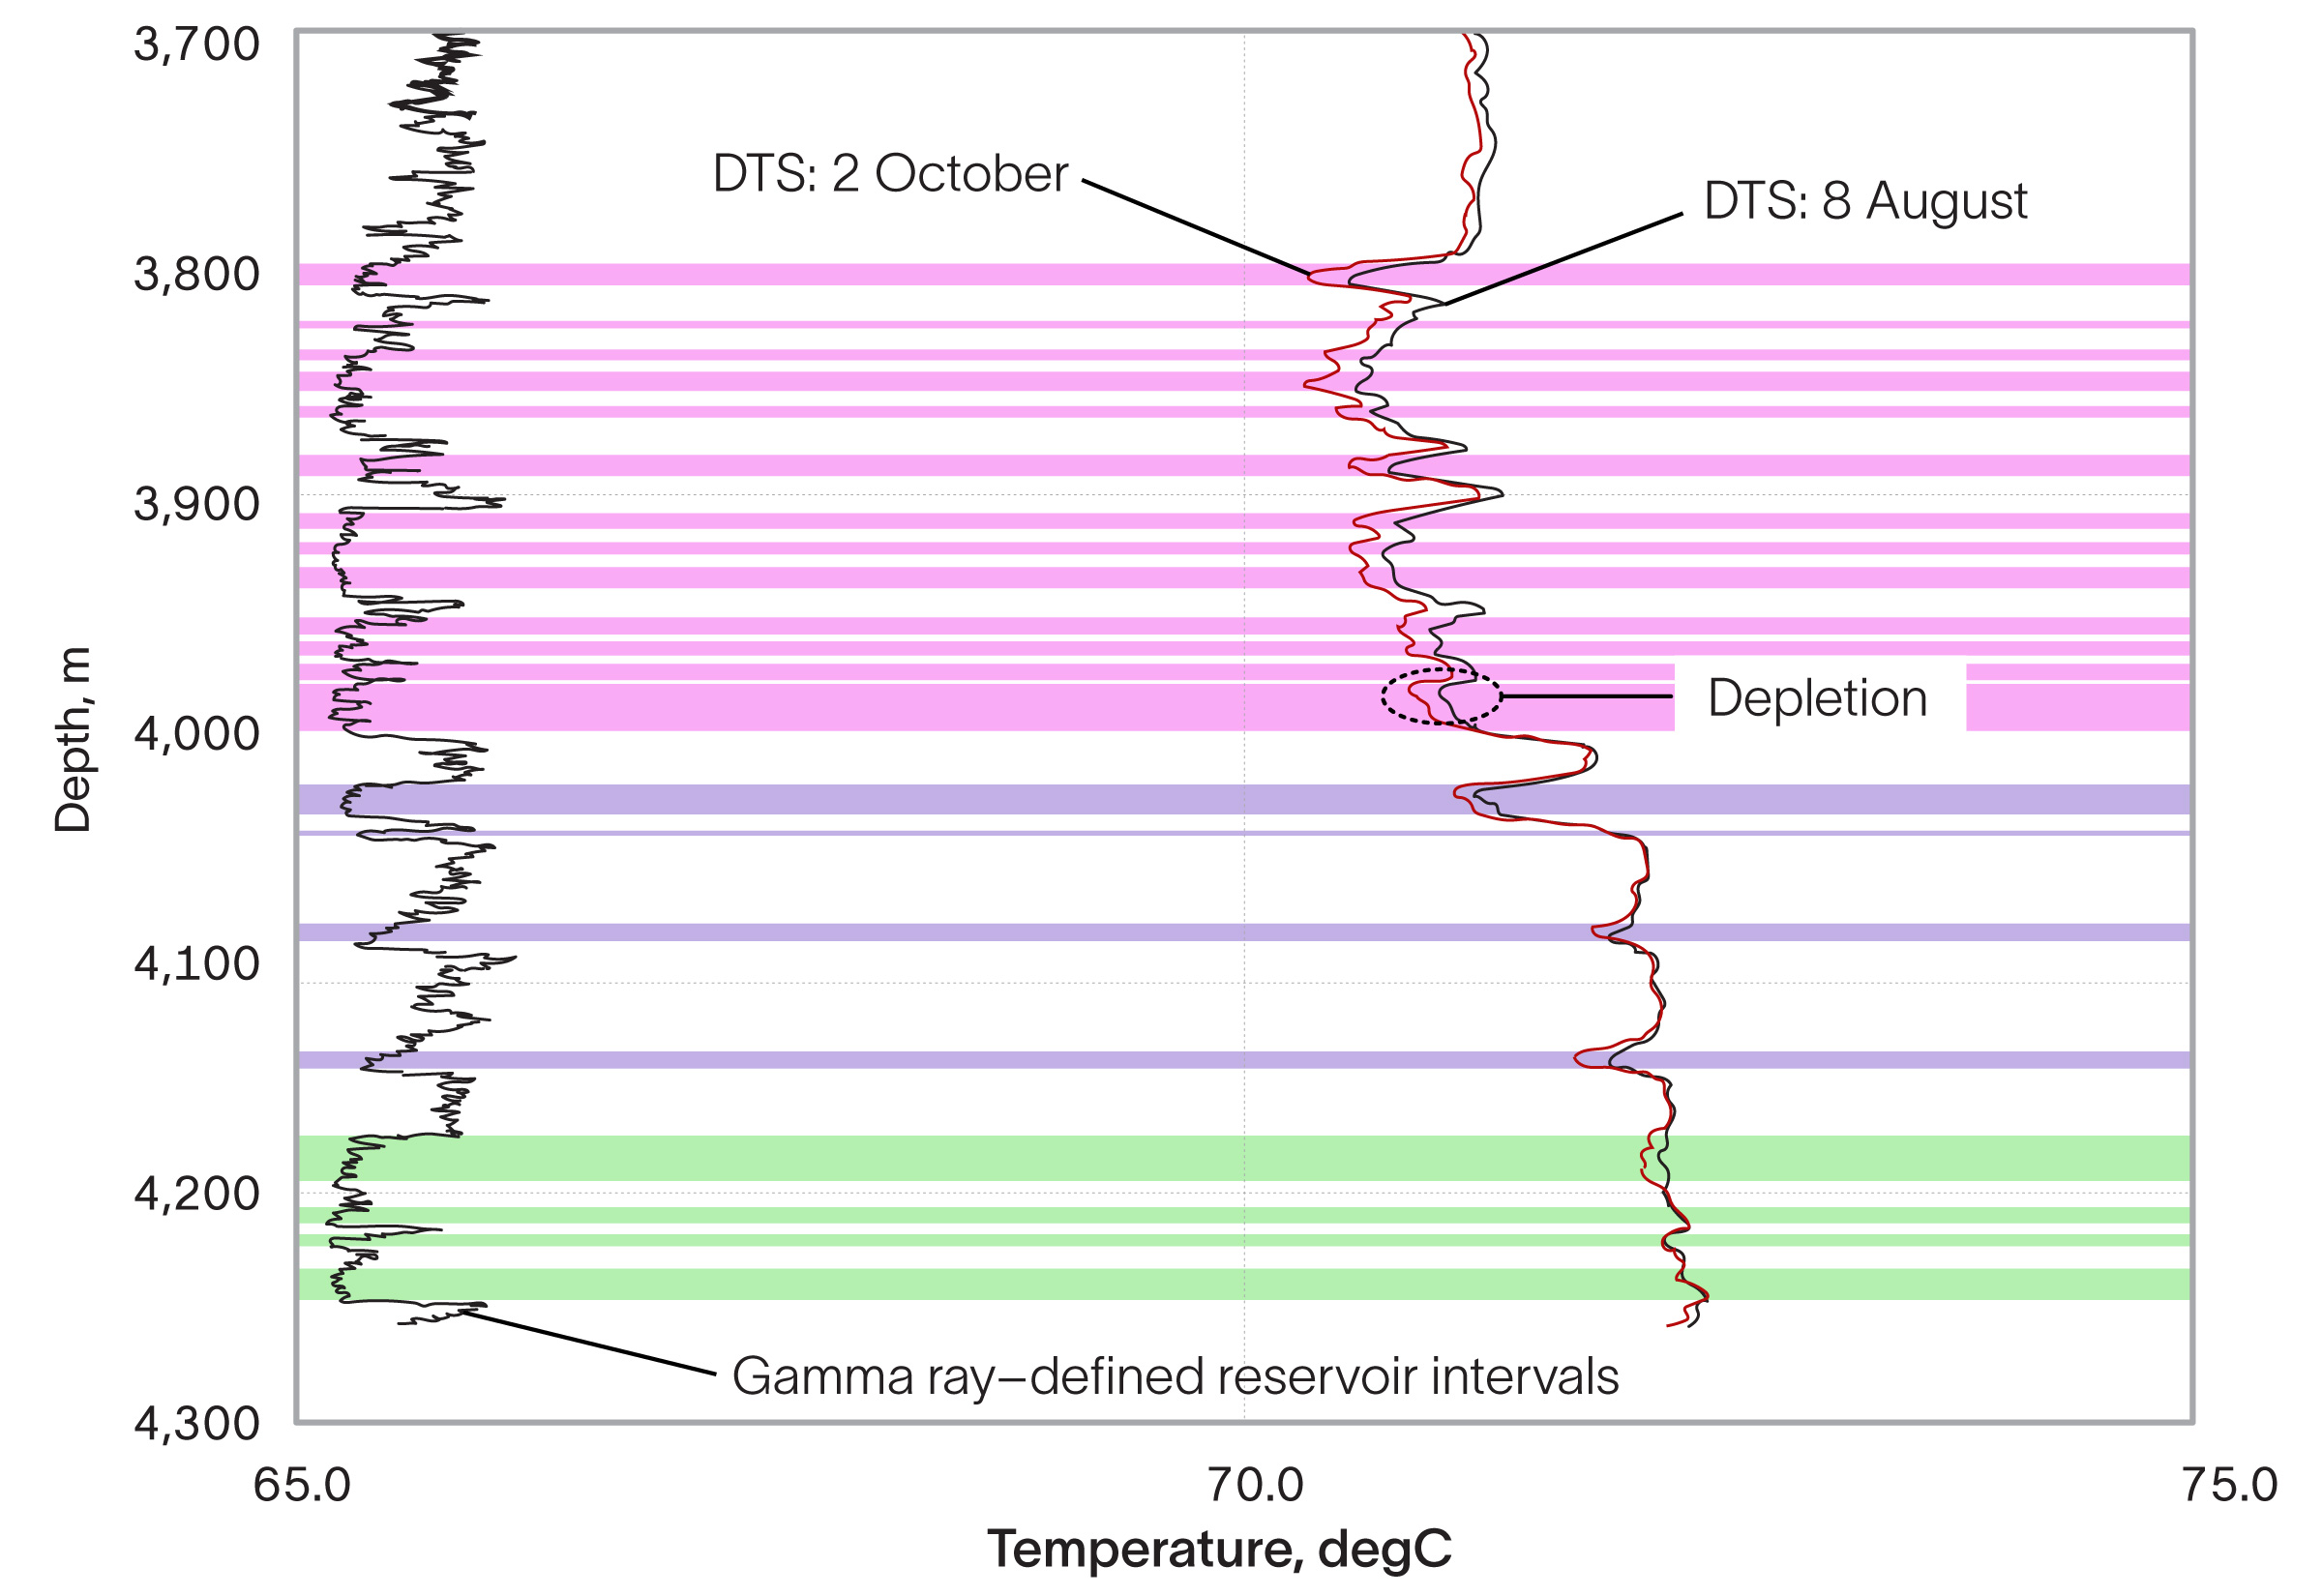
bp chose Optiq fiber-optic solutions. Optical fiber provides distributed temperature profiles that can be monitored at the surface in real time, and—unlike production logging tools—it requires no intervention after installation. The fiber was installed on the exterior of the fiber-optic-compatible gravel-pack sand screens across the reservoir interval, enabling it to react to the temperature changes of each flowing layer.
Fluid flows from a reservoir into a wellbore because of a pressure drop. This movement and subsequent Joule-Thomson effect cause the fluid to change temperature from its normal geothermal value. When the reservoir fluid passes through the sand screen, it mixes with the flow coming up the basepipe from layers below, and the temperature changes again. These two temperatures—Joule-Thomson and axial mixture—along with reservoir properties and well test data form the basis of a thermal well model, which is calculated using Optiq real-time (RT) fiber-optic interpretation and analysis.
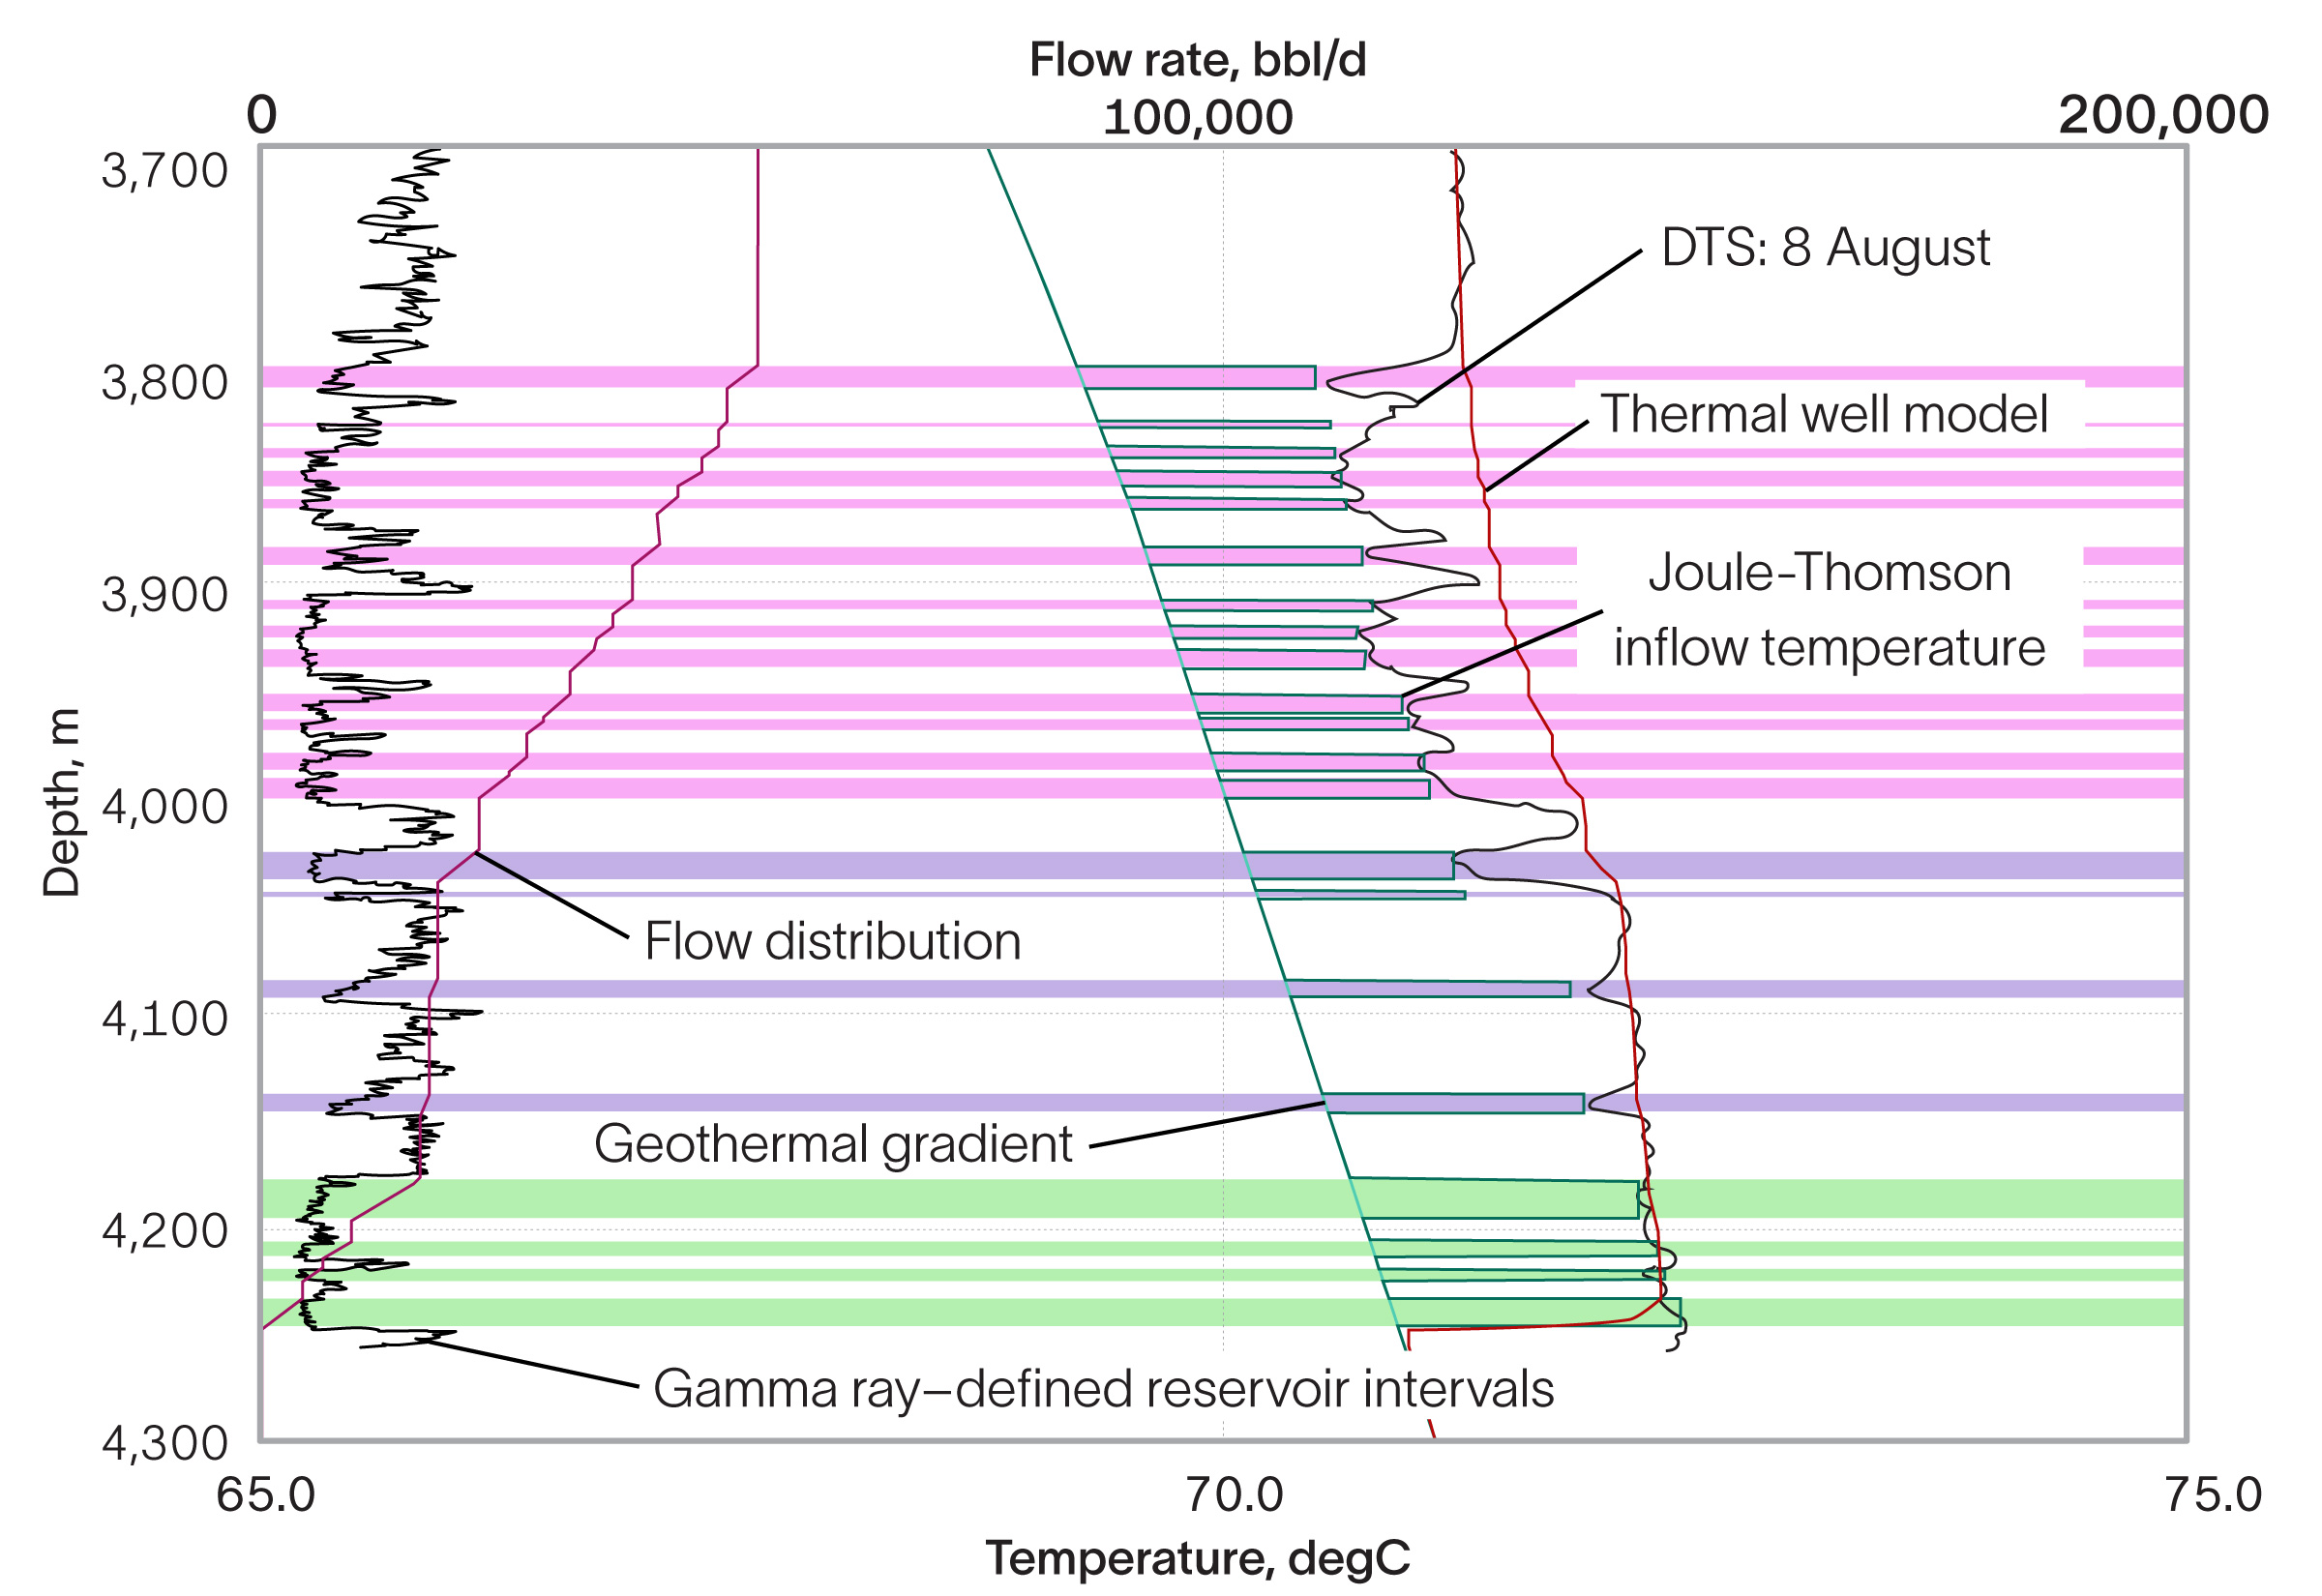
Matching the thermal well model and the measured DTS profile produces an initial flow profile. As the temperature profile changes over time, the model can be recalibrated by history matching the gauge information and adjusting the rest of the parameters to enhance water injection and reservoir management.
Improved reservoir management strategy and optimized drainage of secondary oil
The continuous temperature profiles of individual reservoir zones, made possible by Optiq fiber-optic solutions, enabled the effects of differential depletion to be monitored over time. As a result, bp improved its reservoir management strategy for water injection and oil drainage—optimizing the drainage of more than 100 million bbl of secondary oil. The lessons learned from this project contributed to well placement decisions for future wells and led bp to deploy optical fiber in its subsequent ACG operations. See SPE 110064 for more details.