Techlog Core Systems
An integrated and extensible modern architecture that empowers productivity across all well related workflows
An integrated and extensible modern architecture that empowers productivity across all well related workflows.

Data Import
Data can be dropped directly into the editor from the import or export buffers prior to transfer. Other key import features within the Techdata module include:
The simple principles of a “data family” or “data alias” allow you to rapidly harmonize names, units, scales, colours, etc., across your entire project. This also enables you to automatically control preferential data selection.
Graphical methods within the module allow analysts to keep control of their processes. For example, it is possible to graphically edit, trim, clip, depth shift, delete, join, merge (splice), despike, smooth, interpolate, and standardize data, right off the plot.
The Techdata module enables mathematical operations to be performed on your data, such as find derivatives, integrate, filter, spline or linearly interpolate, and standardize. It is also possible to apply powerful frequency domain filtering.
Using the Techplot platform module, complex plot templates involving many wells can be adapted by duplication and the altering of input data control, or by applying the same template to other groups of wells.
Techplot software allows quick capture and export (clipboard or files) of the workspace or of a specific graphical area of your working environment.
Using the Techplot header editor, you can create, edit, and share your common standard headers. Fields and tables from within wells can be automatically filled in with dataset or variable properties.
Techlog projects can be run using different unit systems (e.g., metric, imperial, Canadian, and Russian units). Project templates improve efficiency and consistency of corporate display standards. The well schematics assist with the visualization of perforated zones, completions, etc.
Techlog software stores and manipulates (e.g., in plot tools and the Data Editor) data that were acquired against a date-time reference (typically MWD or LWD data). This both improves and extends the use of Techlog wellbore software in the real-time management of data.
Data that was acquired against a date-time reference (e.g., LWD or MWD) can be easily displayed in a Logview window.
Tracks may have their own plot scale (called “zoom factor”), allowing montages combining overview scale with detailed scale plots to be created (e.g., when incorporating core photographs).
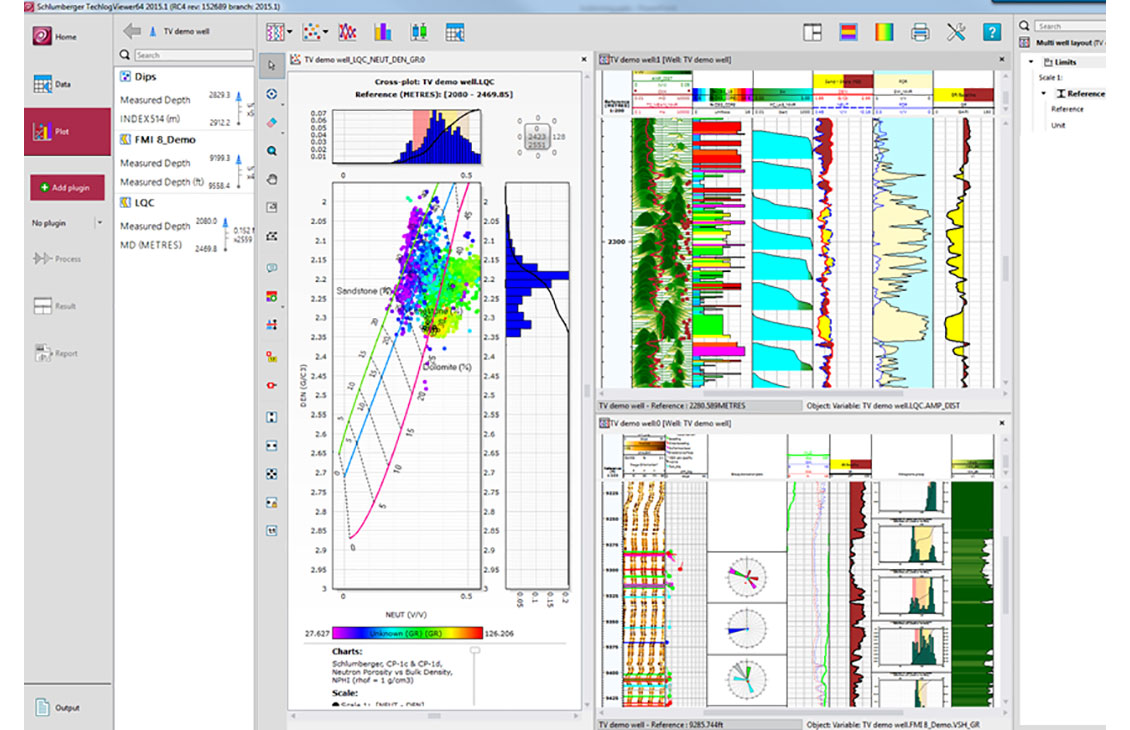
Thanks to full interactivity, the Techlog viewers serve as easy-to-use, powerful analysis tools. You can choose data in one view, and all instances of the chosen references are highlighted within any type of coexistent plot. The selection remains live in the memory of the computer, so plots with the same references can be linked even if they have no curves in common.
A layout for a single well can be designed and then applied to one or more other wells in the project with a single mouse click. There are no software limits to the number of wells included in a plot; if required, these tools can accommodate tens of thousands of data points.
The Techplot program allows you to combine headers, layouts, cross-plots, histograms, and pictures into a single deliverable document.
The Techlog Base is the foundation of the software delivering the fundamental data loading and editing to populate projects and start the analysis process. These include the following functionality:
* Additional module required.
** Appropriate connector required.

NExT offers a comprehensive training program to support users of the SLB software, plugins, and other software products.

The Techlog BASE is the foundation of the whole suite upon which the rest of the modules meet in a tightly integrated environment to deliver all of the elements.

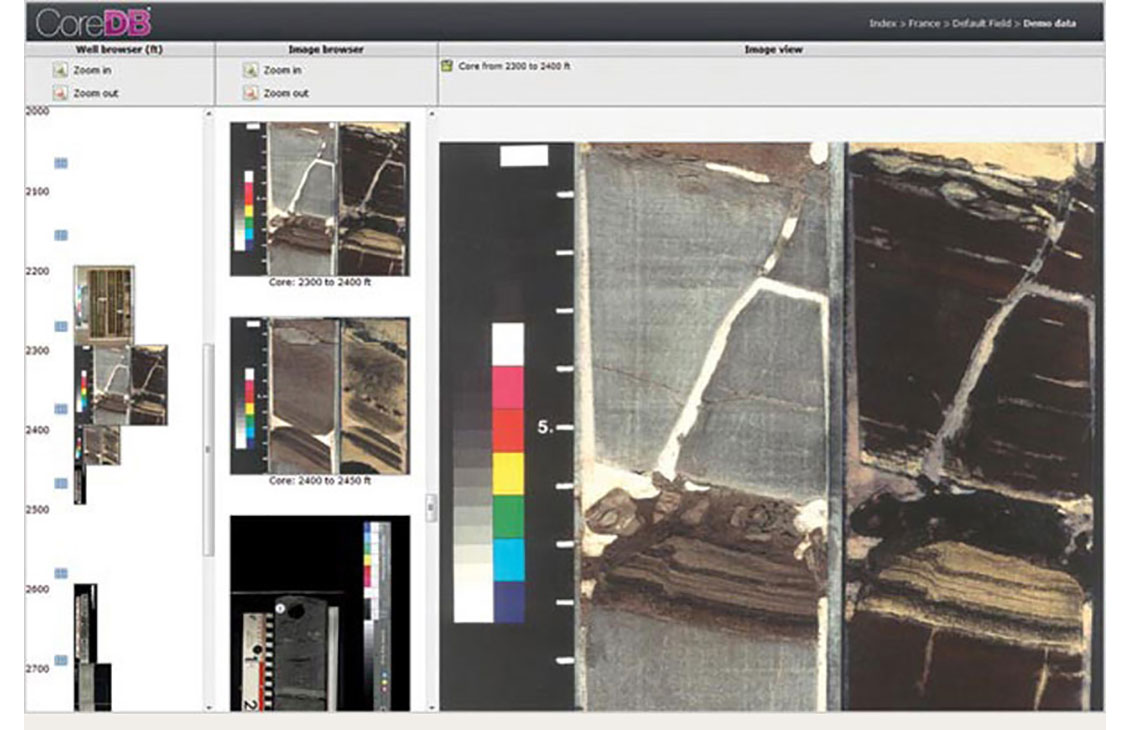
Easily catalog all core results and experimental conditions in a robust database with a highly interactive and customizable interface.

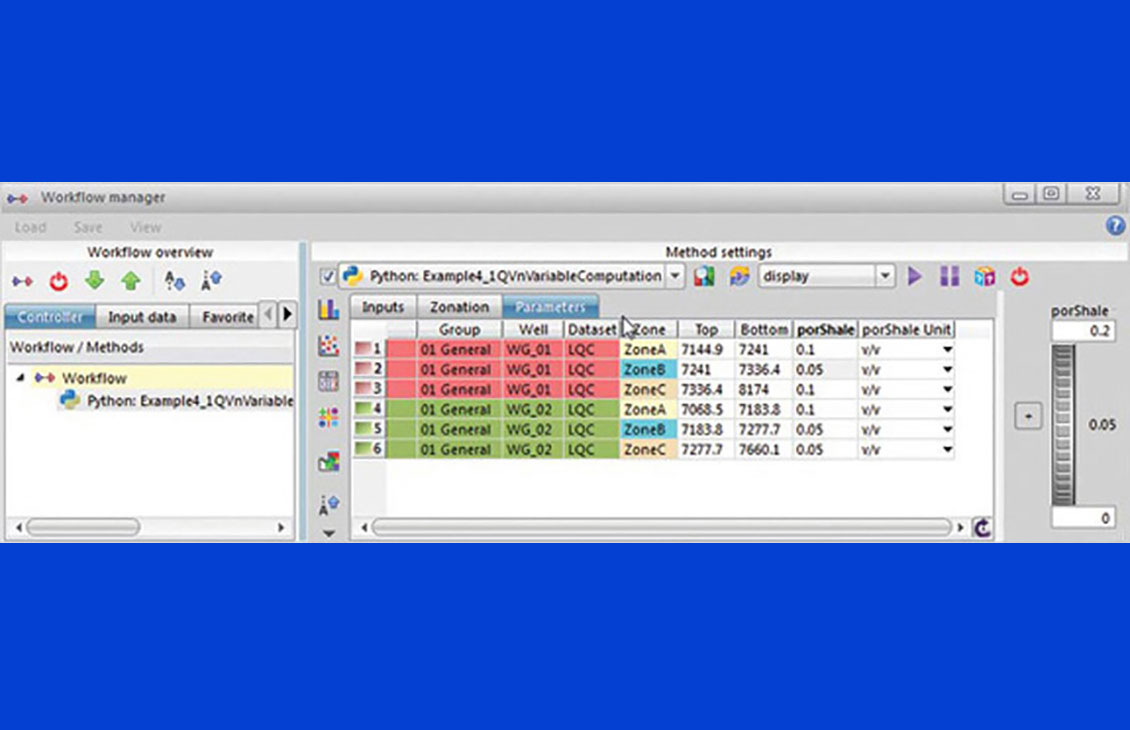
Go further with full extensibility and openness.

Get your data on time—real-time visualization and interpretation of streaming data from the wellsite

The foundation of the whole suite upon which the rest of the modules meet in a tightly integrated environment to deliver results.

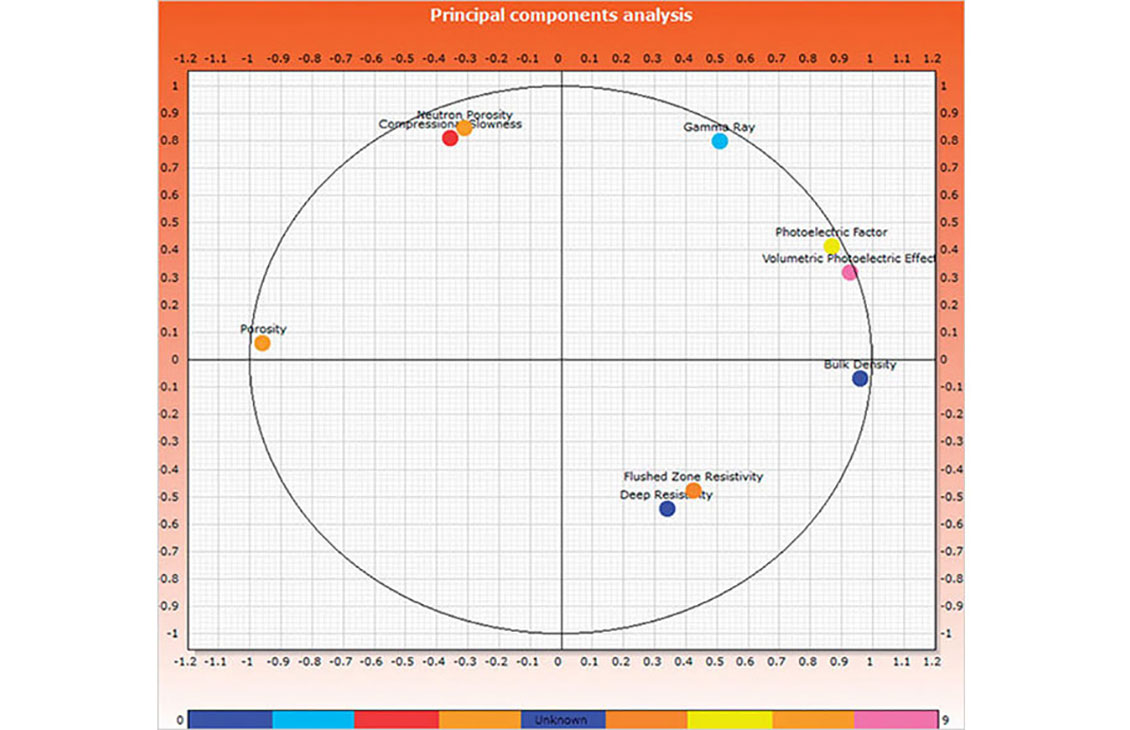
Comprehensive exploratory data analysis.

A simplified, lightweight user interface for data analysis and specific workflows.