Techlog Quanti
Basic to advanced interactive log interpretation
Basic to advanced interactive log interpretation.
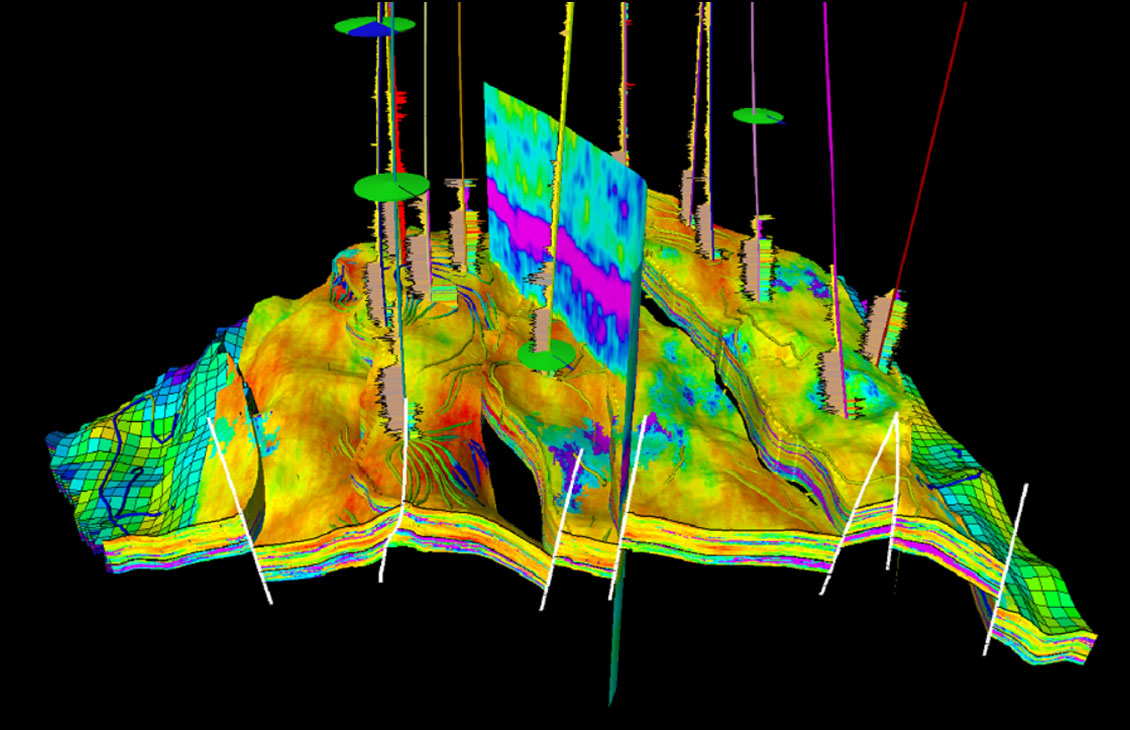
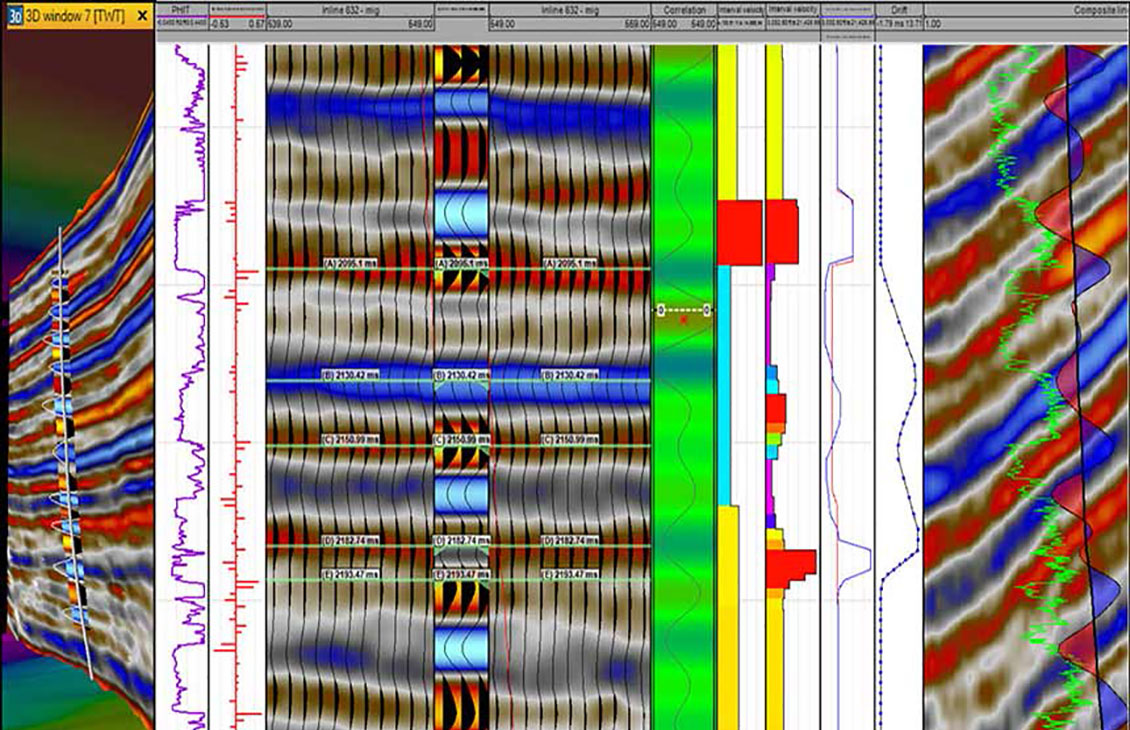
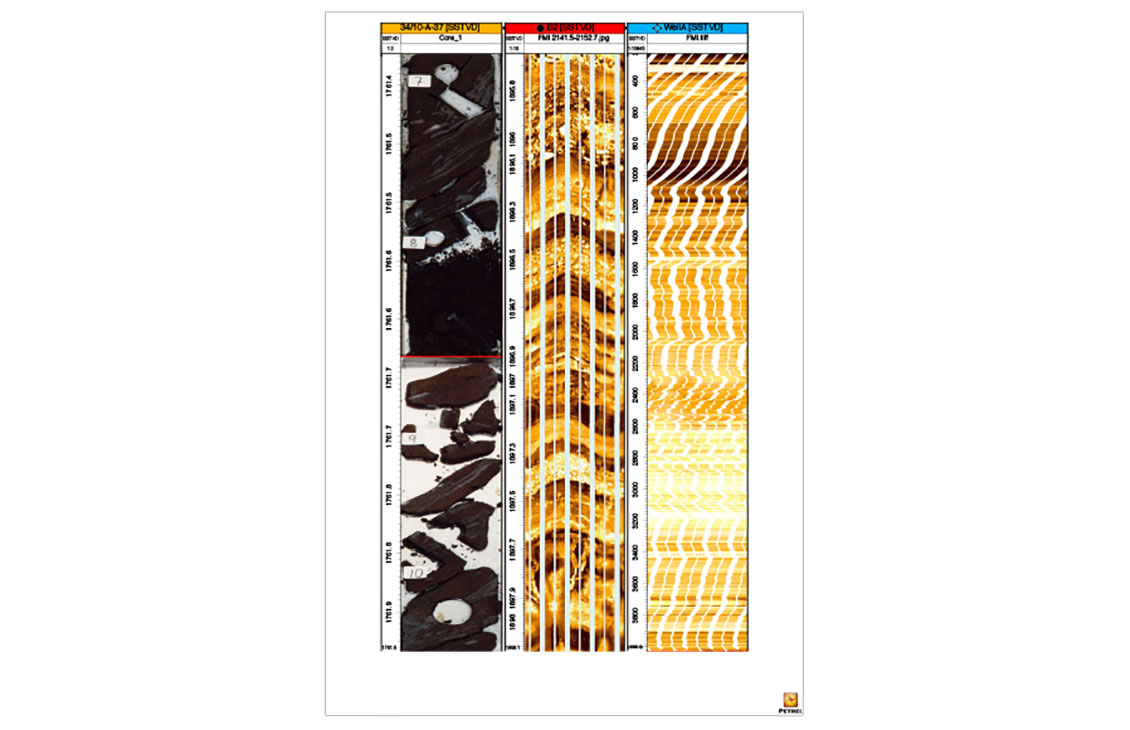
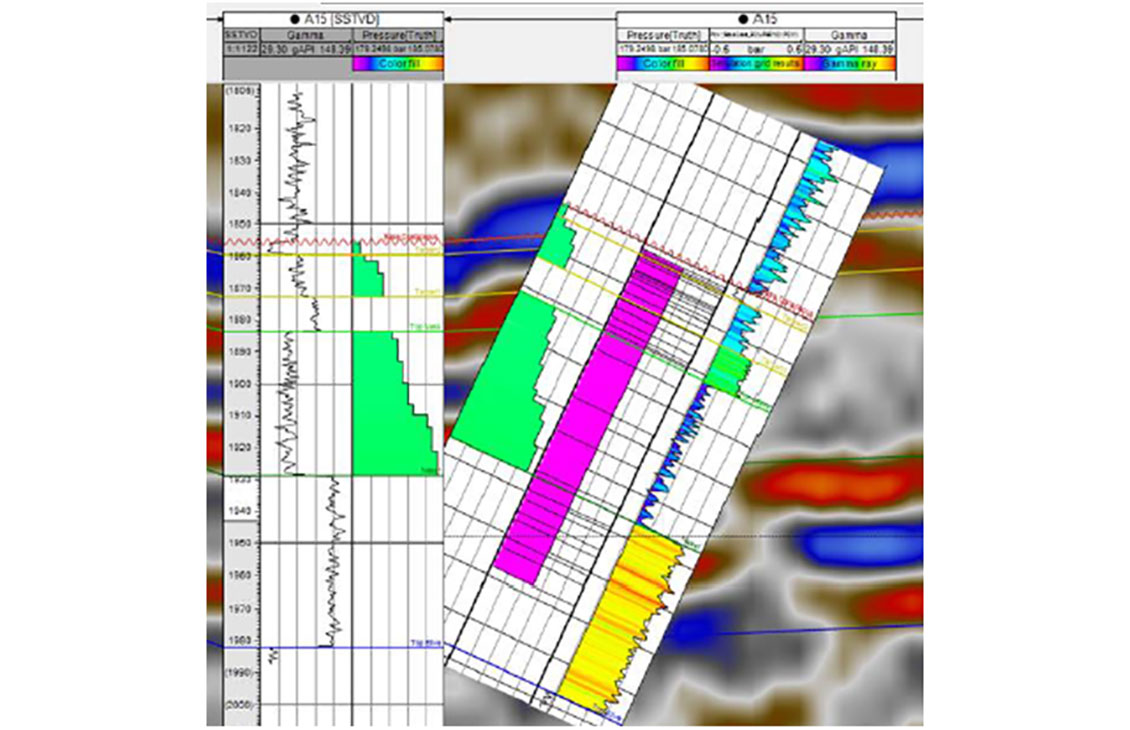
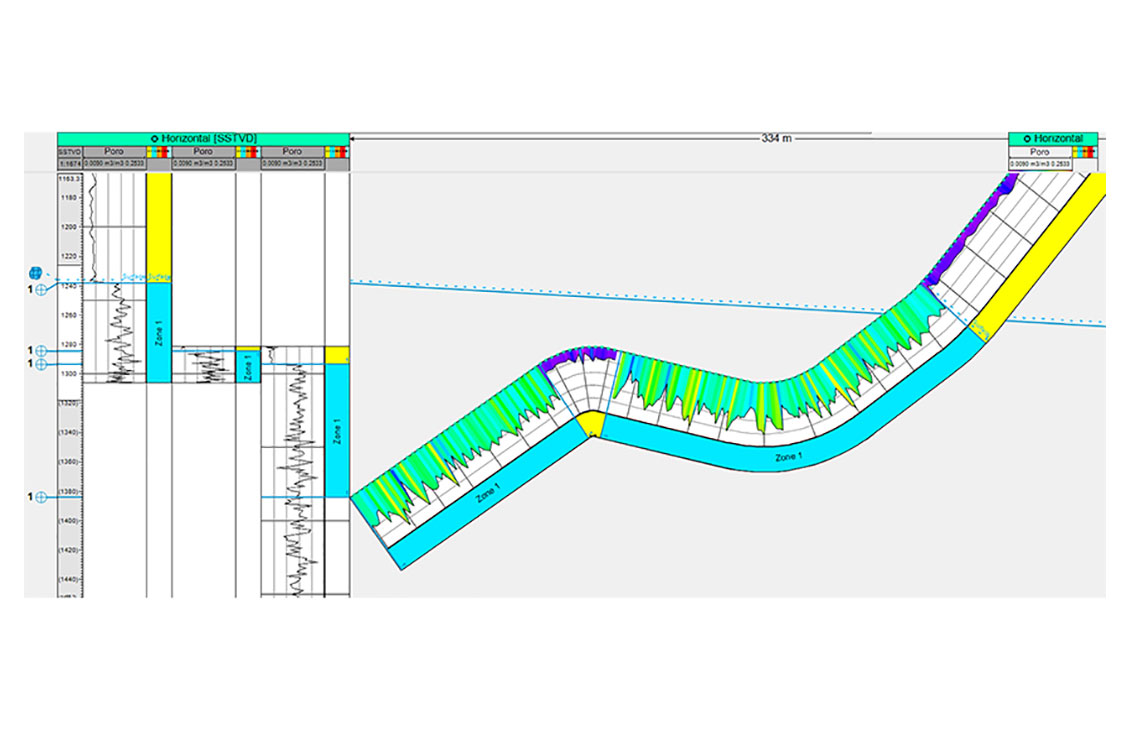
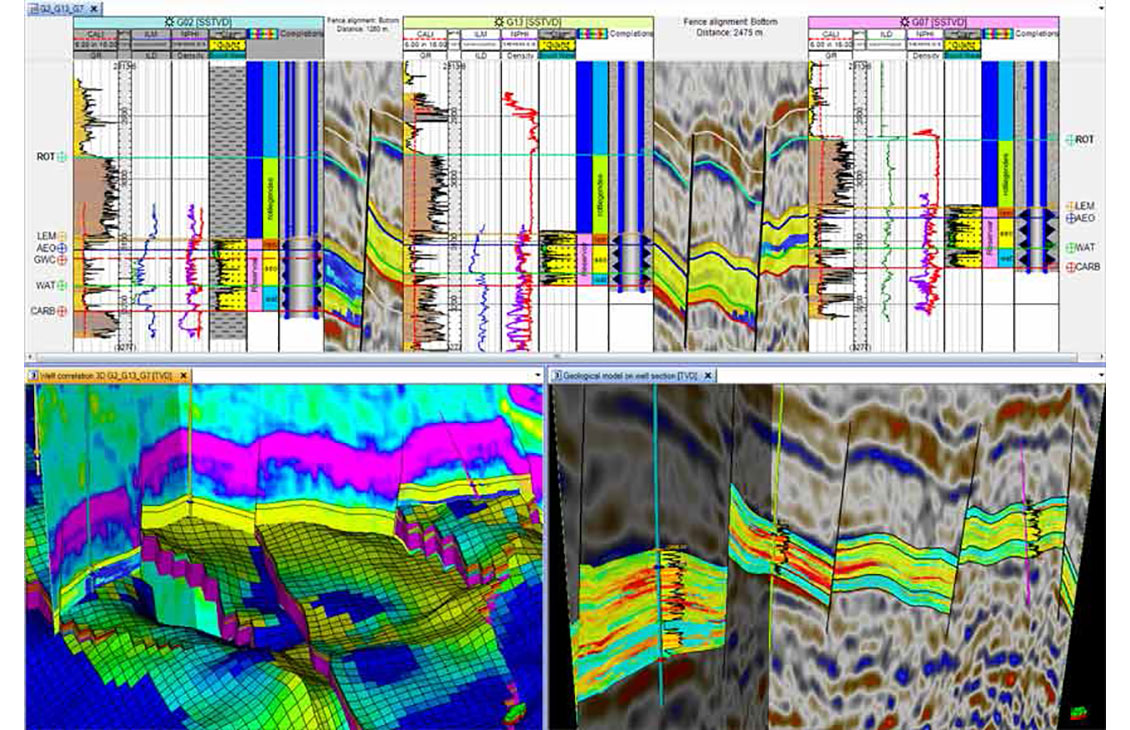
Petrel™ well correlation provides a clean correlation canvas on which to display logs, core images, seismic data, grid data, and even completions and simulation results—which can be played through time. Users can geosteer horizontal and highly deviated wells with SLB LWD tools in real time, and deviated wells can be displayed overlain on seismic or 3D grid properties.
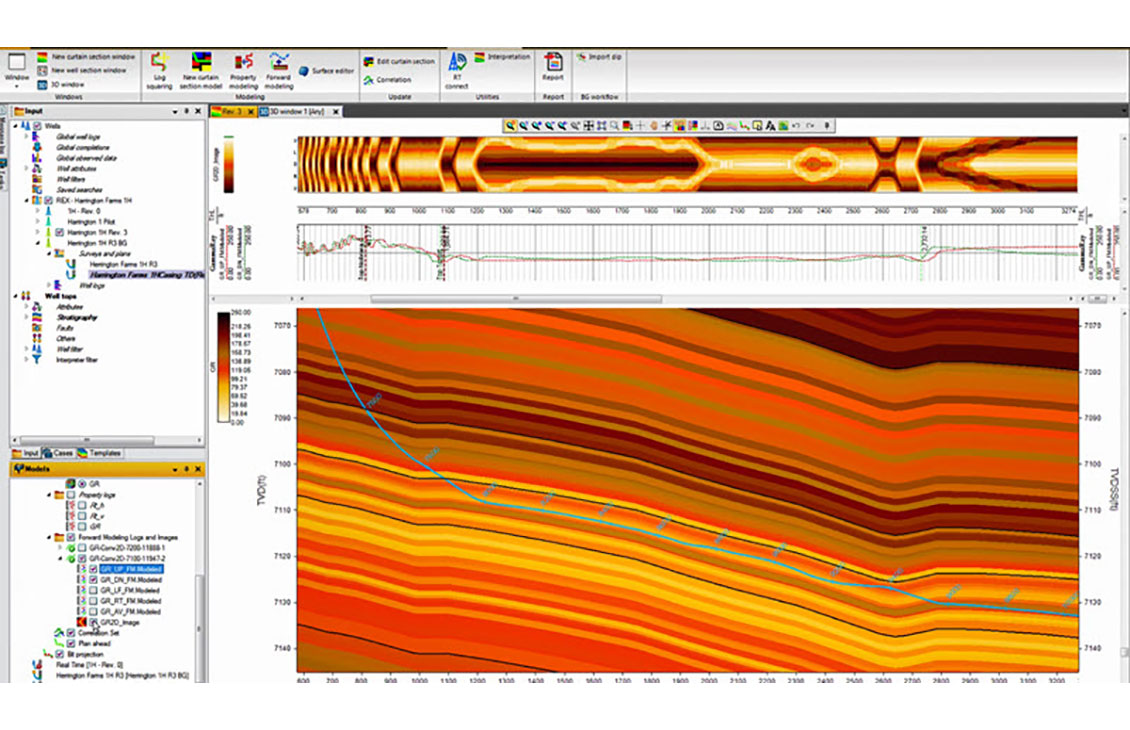
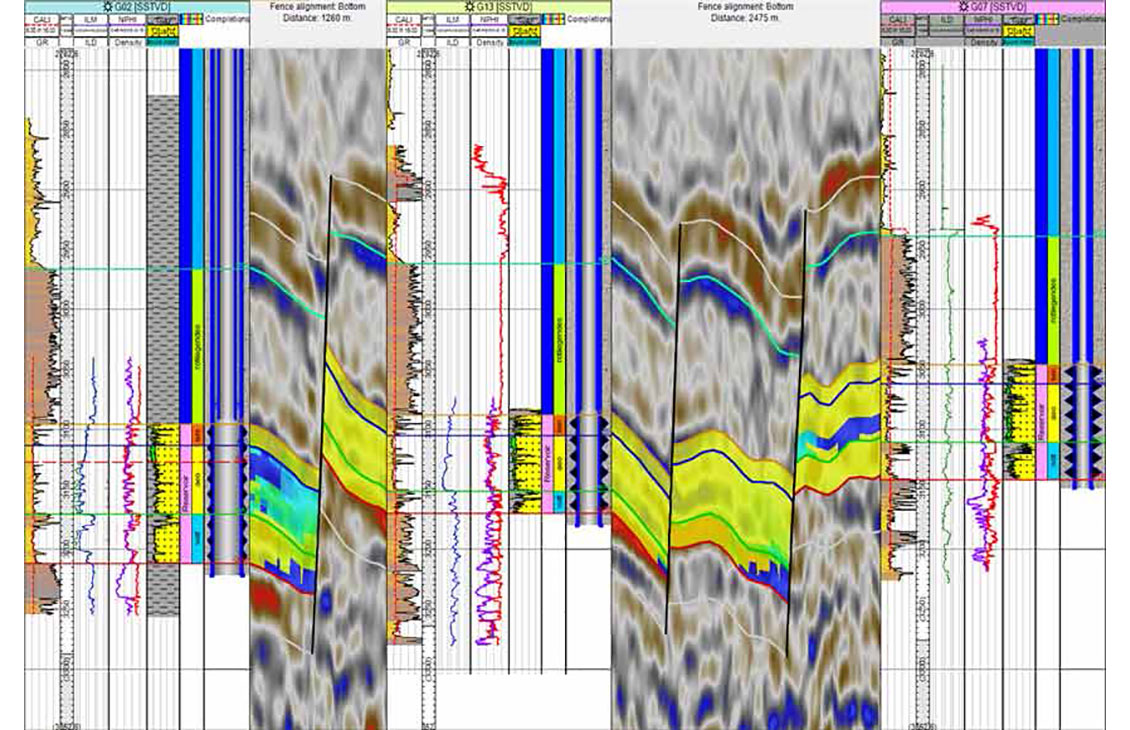
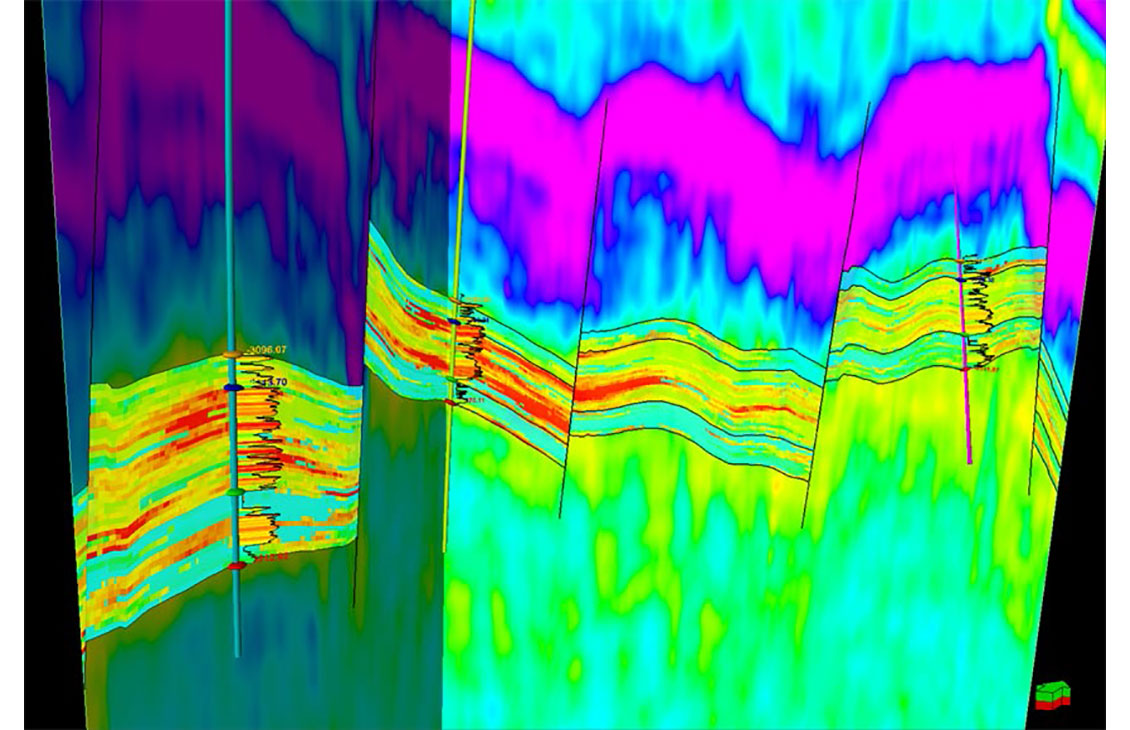
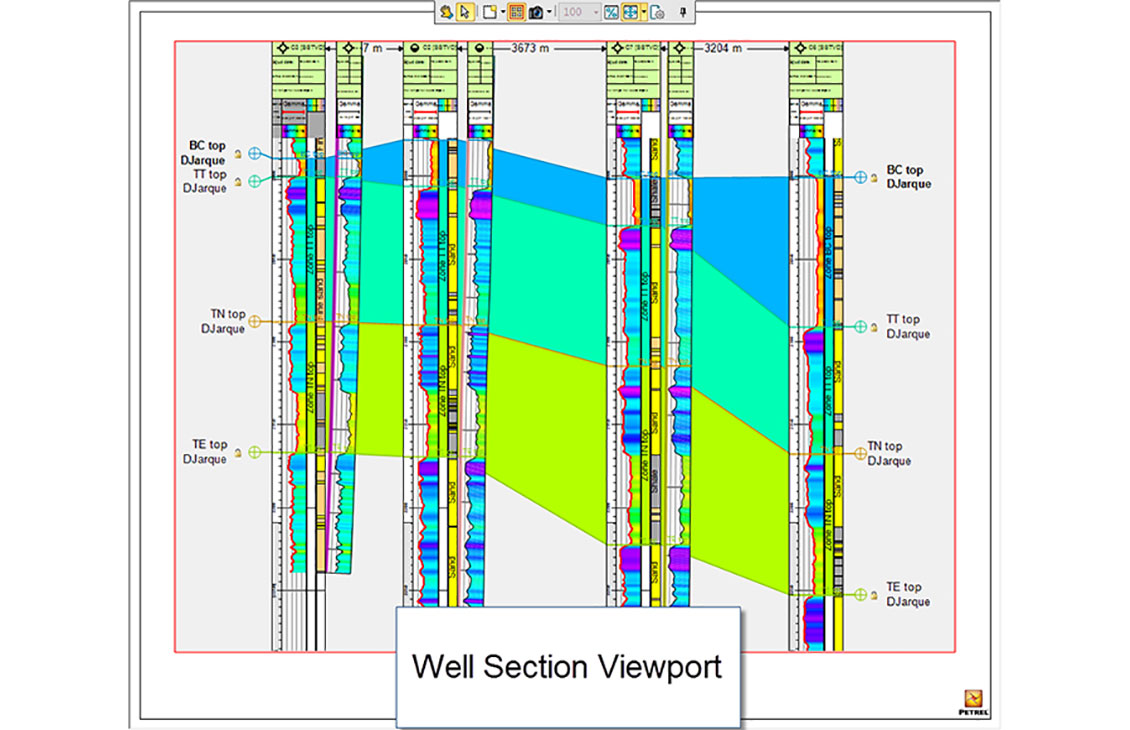
Cross sections can be interactively created and shared across projects and also be directly edited in the 2D or map window. Tools for picking markers, estimating logs by trained neural networks, and performing interactive log conditioning enable robust stratigraphic interpretation. The advanced visualization performance easily handles thousands of wells simultaneously.

NExT training courses address the unique needs of each learner. Our courses, led by distinguished experts in their fields, equip learners with the skills to address practical situations and resolve real-world challenges.
Analyze any data from all angles
Enabling geoscientists to rapidly screen and evaluate basin and petroleum systems using both 1D and 3D modeling.
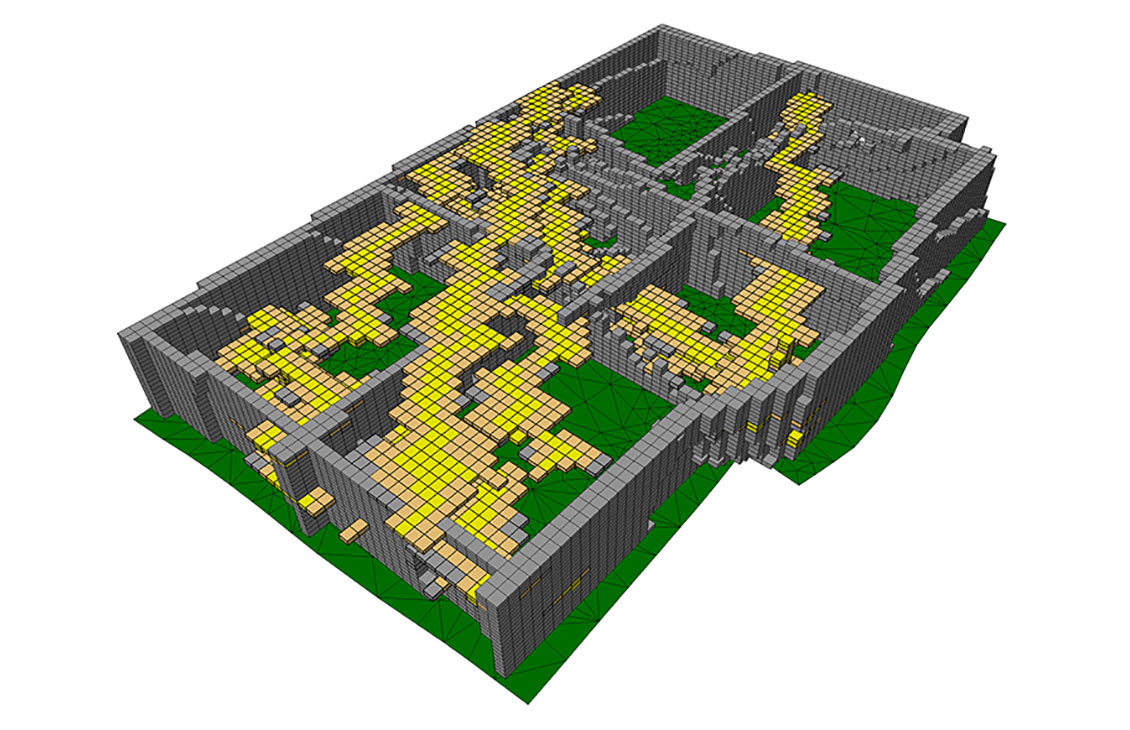
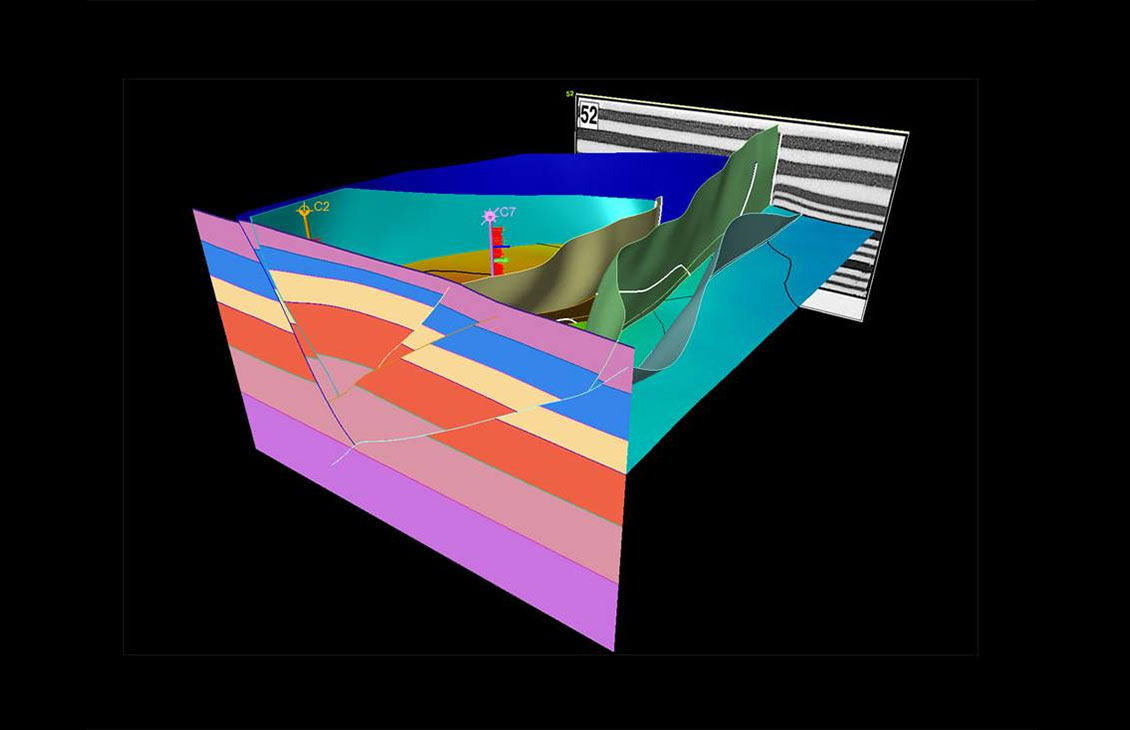
Build accurate facies models
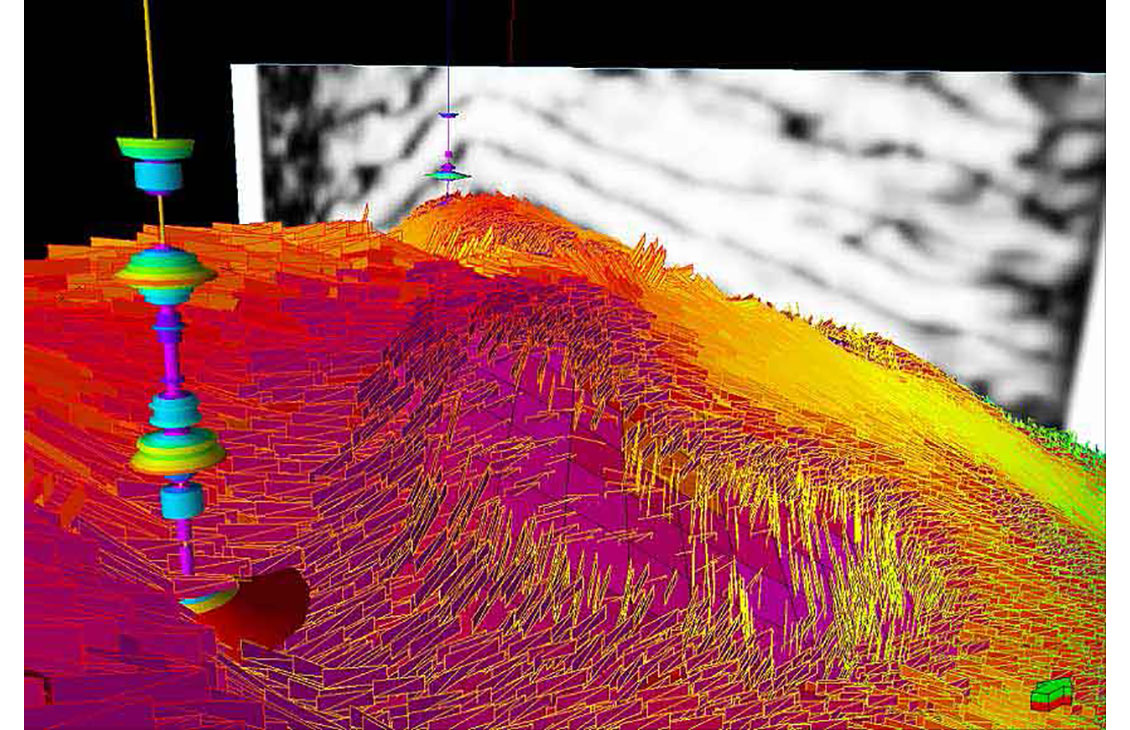
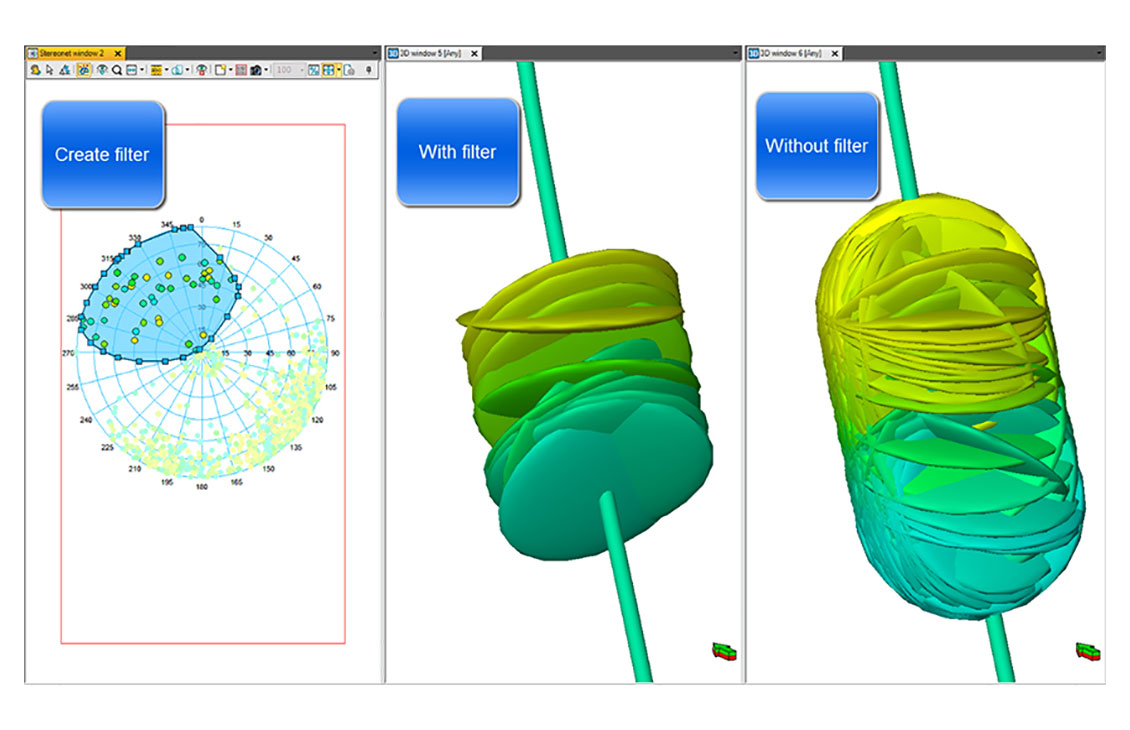
Create geologically consistent fracture models
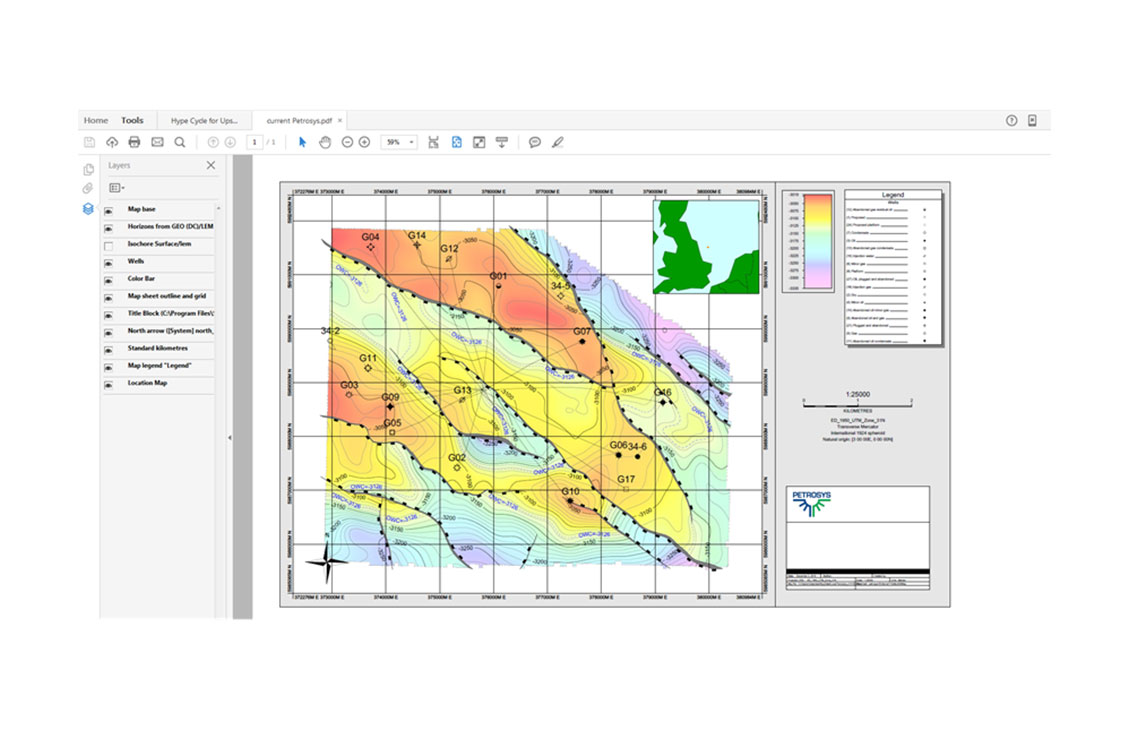
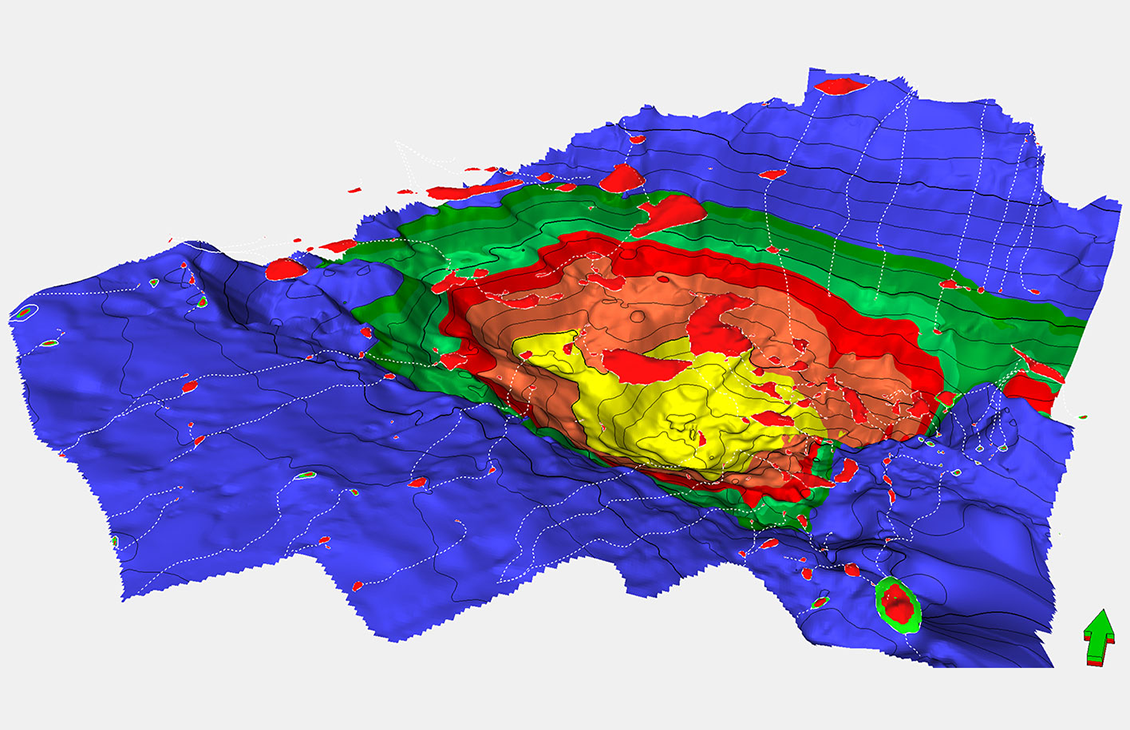
Advanced presentation quality mapping.
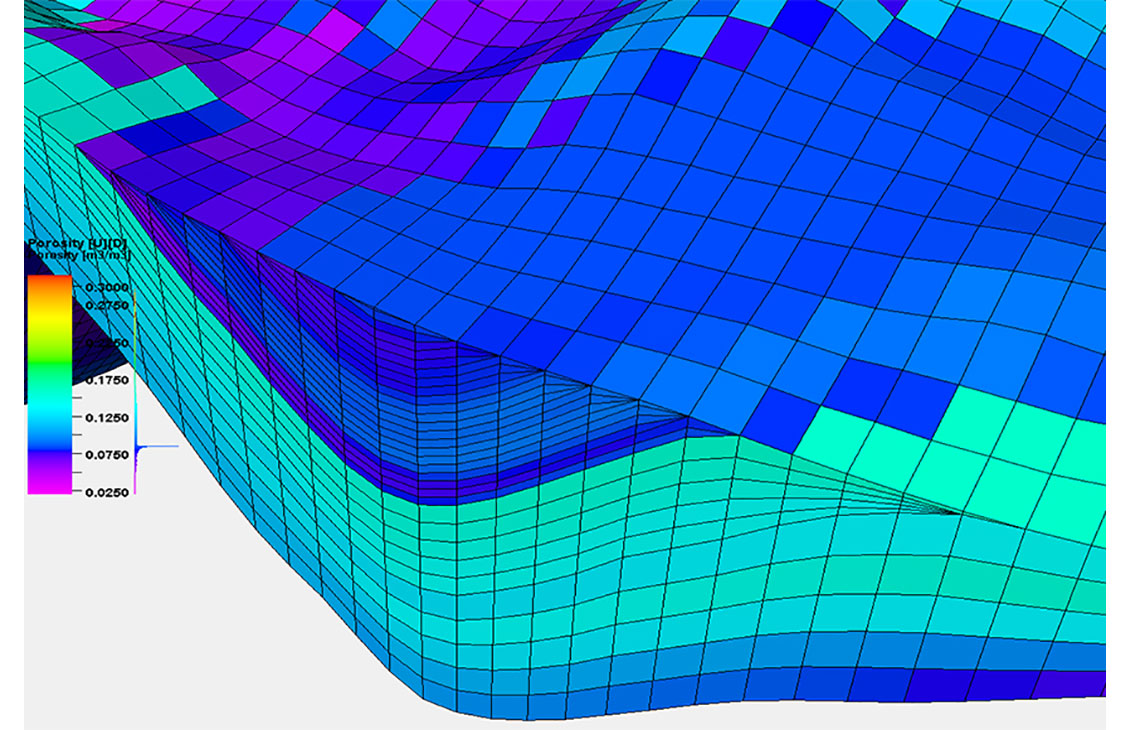
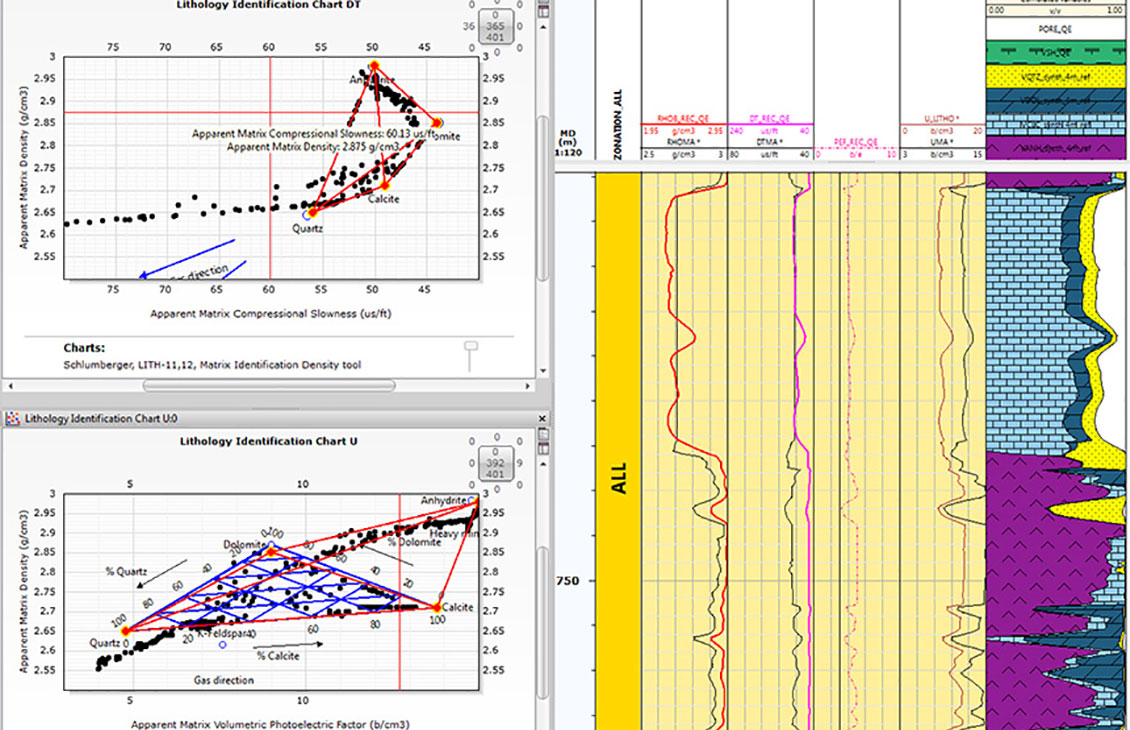
Build accurate petrophysical models
Achieving production objectives with full stochastic evaluation of exploration portfolios
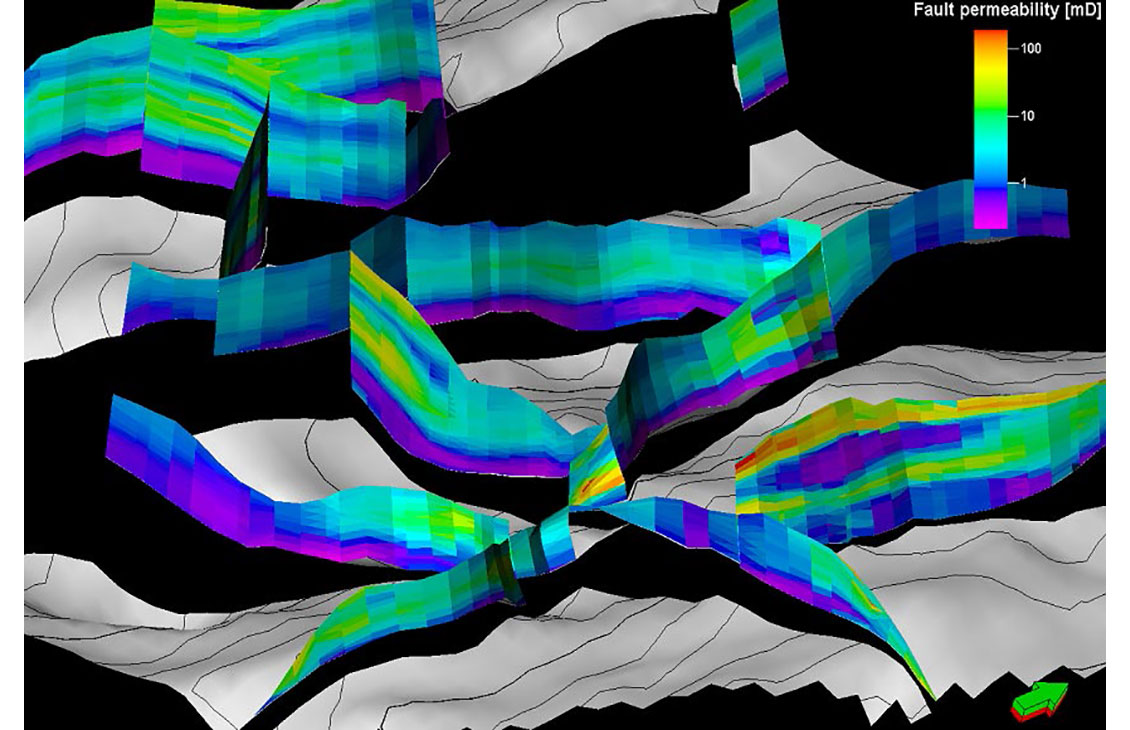
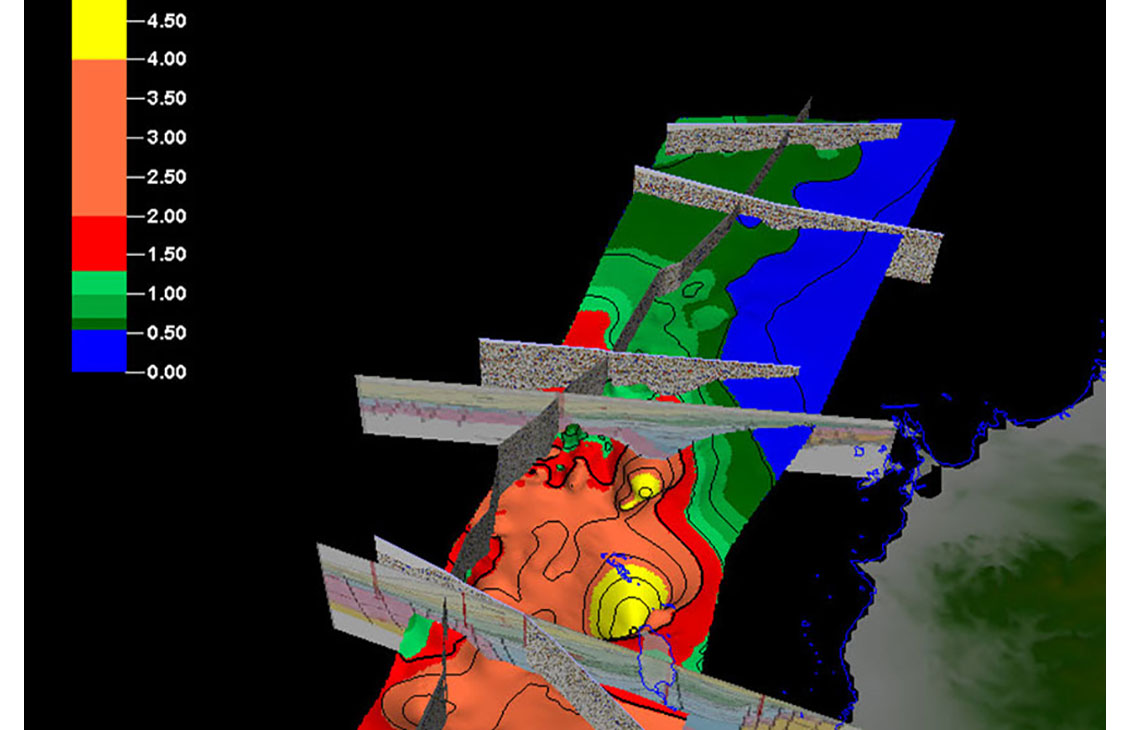
Analysis of fault sealing capabilities and mapping QC tools
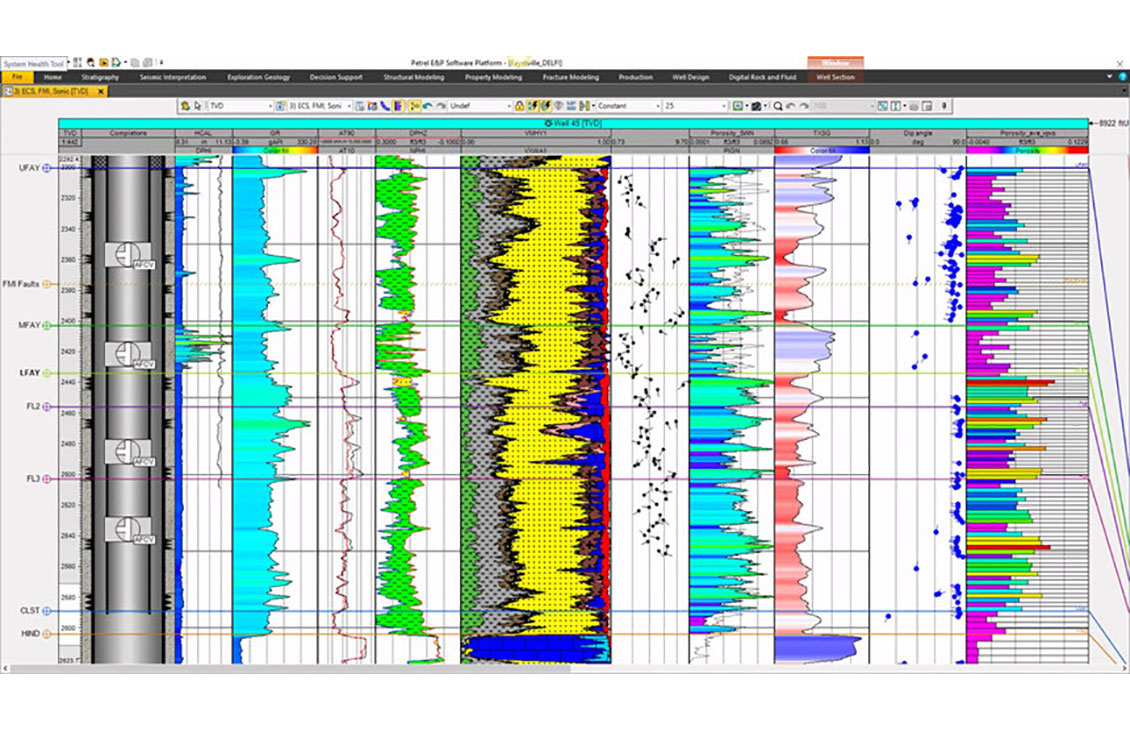
Display, organize, and interpret any type of well data in a flexible 2D environment